

Composite Selection Signals for Complex Traits Exemplified Through Bovine Stature Using Multibreed Cohorts of European and African Bos taurus
- PMID: 25931611
- PMCID: PMC4502373
- DOI: 10.1534/g3.115.017772
Composite Selection Signals for Complex Traits Exemplified Through Bovine Stature Using Multibreed Cohorts of European and African Bos taurus
Abstract
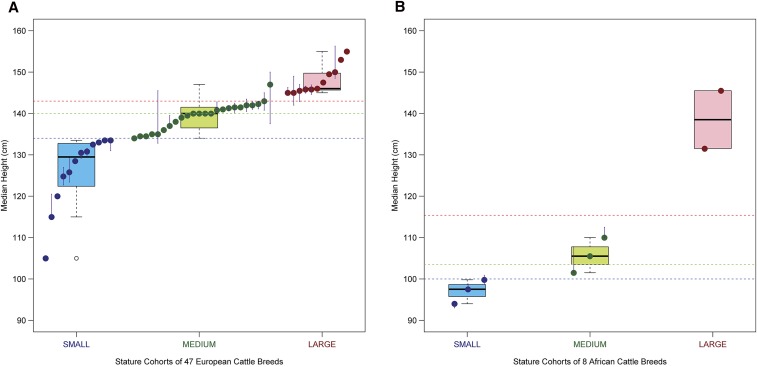
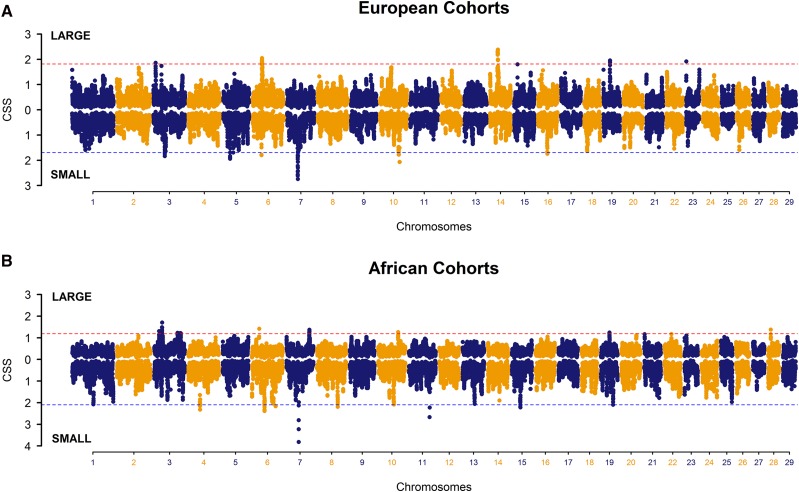
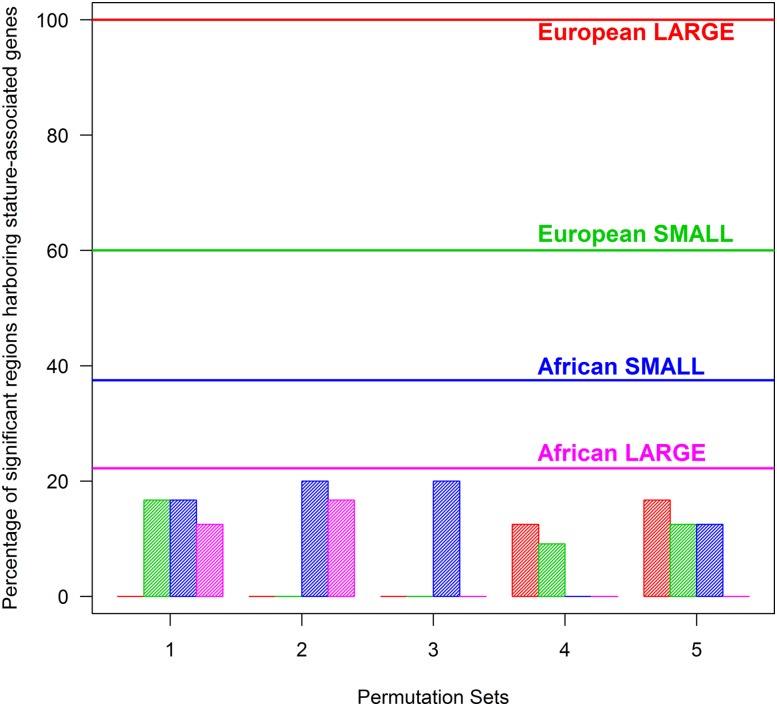
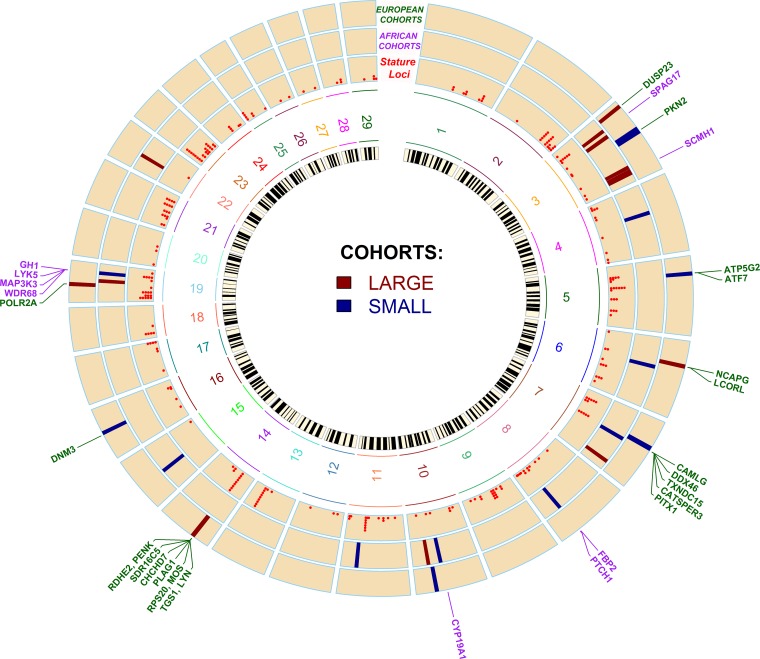
Understanding the evolution and molecular architecture of complex traits is important in domestic animals. Due to phenotypic selection, genomic regions develop unique patterns of genetic diversity called signatures of selection, which are challenging to detect, especially for complex polygenic traits. In this study, we applied the composite selection signals (CSS) method to investigate evidence of positive selection in a complex polygenic trait by examining stature in phenotypically diverse cattle comprising 47 European and 8 African Bos taurus breeds, utilizing a panel of 38,033 SNPs genotyped on 1106 animals. CSS were computed for phenotypic contrasts between multibreed cohorts of cattle by classifying the breeds according to their documented wither height to detect the candidate regions under selection. Using the CSS method, clusters of signatures of selection were detected at 26 regions (9 in European and 17 in African cohorts) on 13 bovine autosomes. Using comparative mapping information on human height, 30 candidate genes mapped at 12 selection regions (on 8 autosomes) could be linked to bovine stature diversity. Of these 12 candidate gene regions, three contained known genes (i.e., NCAPG-LCORL, FBP2-PTCH1, and PLAG1-CHCHD7) related to bovine stature, and nine were not previously described in cattle (five in European and four in African cohorts). Overall, this study demonstrates the utility of CSS coupled with strategies of combining multibreed datasets in the identification and discovery of genomic regions underlying complex traits. Characterization of multiple signatures of selection and their underlying candidate genes will elucidate the polygenic nature of stature across cattle breeds.
Keywords: body size; outbred populations; polygenic traits; signatures of selection; stature genes.
Copyright © 2015 Randhawa et al.
Figures
Similar articles
-
Composite selection signals can localize the trait specific genomic regions in multi-breed populations of cattle and sheep.BMC Genet. 2014 Mar 17;15:34. doi: 10.1186/1471-2156-15-34. BMC Genet. 2014. PMID: 24636660 Free PMC article.
-
Detection of selection signatures in dairy and beef cattle using high-density genomic information.Genet Sel Evol. 2015 Jun 19;47(1):49. doi: 10.1186/s12711-015-0127-3. Genet Sel Evol. 2015. PMID: 26089079 Free PMC article.
-
An interpretive review of selective sweep studies in Bos taurus cattle populations: identification of unique and shared selection signals across breeds.Front Genet. 2015 May 13;6:167. doi: 10.3389/fgene.2015.00167. eCollection 2015. Front Genet. 2015. PMID: 26029239 Free PMC article. Review.
-
A novel analytical method, Birth Date Selection Mapping, detects response of the Angus (Bos taurus) genome to selection on complex traits.BMC Genomics. 2012 Nov 9;13:606. doi: 10.1186/1471-2164-13-606. BMC Genomics. 2012. PMID: 23140540 Free PMC article.
-
Assessing genomic diversity and signatures of selection in Jiaxian Red cattle using whole-genome sequencing data.BMC Genomics. 2021 Jan 9;22(1):43. doi: 10.1186/s12864-020-07340-0. BMC Genomics. 2021. PMID: 33421990 Free PMC article. Review.
Cited by
-
Adaptive introgression from indicine cattle into white cattle breeds from Central Italy.Sci Rep. 2020 Jan 28;10(1):1279. doi: 10.1038/s41598-020-57880-4. Sci Rep. 2020. PMID: 31992729 Free PMC article.
-
Genomic Characterisation of the Indigenous Irish Kerry Cattle Breed.Front Genet. 2018 Feb 19;9:51. doi: 10.3389/fgene.2018.00051. eCollection 2018. Front Genet. 2018. PMID: 29520297 Free PMC article.
-
Resequencing Composite Kazakh Whiteheaded Cattle: Insights into Ancestral Breed Contributions, Selection Signatures, and Candidate Genetic Variants.Animals (Basel). 2025 Jan 29;15(3):385. doi: 10.3390/ani15030385. Animals (Basel). 2025. PMID: 39943155 Free PMC article.
-
Pleomorphic adenoma gene1 in reproduction and implication for embryonic survival in cattle: a review.J Anim Sci. 2024 Jan 3;102:skae103. doi: 10.1093/jas/skae103. J Anim Sci. 2024. PMID: 38586898 Free PMC article. Review.
-
Exploring and Identifying Candidate Genes and Genomic Regions Related to Economically Important Traits in Hanwoo Cattle.Curr Issues Mol Biol. 2022 Dec 4;44(12):6075-6092. doi: 10.3390/cimb44120414. Curr Issues Mol Biol. 2022. PMID: 36547075 Free PMC article. Review.
References
-
- Ajmone-Marsan P., Garcia J. F., Lenstra J. A., 2010. On the origin of cattle: How aurochs became cattle and colonized the world. Evol. Anthropol. 19: 148–157.
MeSH terms
LinkOut - more resources
Full Text Sources
Other Literature Sources