Innate responses induced by whole inactivated virus or subunit influenza vaccines in cultured dendritic cells correlate with immune responses in vivo
- PMID: 25933037
- PMCID: PMC4416761
- DOI: 10.1371/journal.pone.0125228
Innate responses induced by whole inactivated virus or subunit influenza vaccines in cultured dendritic cells correlate with immune responses in vivo
Abstract
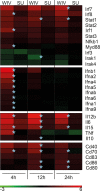
Vaccine development involves time-consuming and expensive evaluation of candidate vaccines in animal models. As mediators of both innate and adaptive immune responses dendritic cells (DCs) are considered to be highly important for vaccine performance. Here we evaluated how far the response of DCs to a vaccine in vitro is in line with the immune response the vaccine evokes in vivo. To this end, we investigated the response of murine bone marrow-derived DCs to whole inactivated virus (WIV) and subunit (SU) influenza vaccine preparations. These vaccine preparations were chosen because they differ in the immune response they evoke in mice with WIV being superior to SU vaccine through induction of higher virus-neutralizing antibody titers and a more favorable Th1-skewed response phenotype. Stimulation of DCs with WIV, but not SU vaccine, resulted in a cytokine response that was comparable to that of DCs stimulated with live virus. Similarly, the gene expression profiles of DCs treated with WIV or live virus were similar and differed from that of SU vaccine-treated DCs. More specifically, exposure of DCs to WIV resulted in differential expression of genes in known antiviral pathways, whereas SU vaccine did not. The stronger antiviral and more Th1-related response of DCs to WIV as compared to SU vaccine correlates well with the superior immune response found in mice. These results indicate that in vitro stimulation of DCs with novel vaccine candidates combined with the assessment of multiple parameters, including gene signatures, may be a valuable tool for the selection of vaccine candidates.
Conflict of interest statement
Figures


Similar articles
-
Whole inactivated virus influenza vaccine is superior to subunit vaccine in inducing immune responses and secretion of proinflammatory cytokines by DCs.Influenza Other Respir Viruses. 2008 Mar;2(2):41-51. doi: 10.1111/j.1750-2659.2008.00038.x. Influenza Other Respir Viruses. 2008. PMID: 19453471 Free PMC article.
-
Effect of viral membrane fusion activity on antibody induction by influenza H5N1 whole inactivated virus vaccine.Vaccine. 2012 Oct 5;30(45):6501-7. doi: 10.1016/j.vaccine.2012.07.036. Epub 2012 Jul 27. Vaccine. 2012. PMID: 22841974
-
Head-to-head comparison of four nonadjuvanted inactivated cell culture-derived influenza vaccines: effect of composition, spatial organization and immunization route on the immunogenicity in a murine challenge model.Vaccine. 2008 Dec 2;26(51):6555-63. doi: 10.1016/j.vaccine.2008.09.057. Vaccine. 2008. PMID: 18848856
-
Opinion: Making Inactivated and Subunit-Based Vaccines Work.Viral Immunol. 2018 Mar;31(2):150-158. doi: 10.1089/vim.2017.0146. Epub 2018 Jan 25. Viral Immunol. 2018. PMID: 29369750 Review.
-
Influenza Pathogenesis in Genetically Defined Resistant and Susceptible Murine Strains .Yale J Biol Med. 2017 Sep 25;90(3):471-479. eCollection 2017 Sep. Yale J Biol Med. 2017. PMID: 28955185 Free PMC article. Review.
Cited by
-
In Vitro Characterization of the Innate Immune Pathways Engaged by Live and Inactivated Tick-Borne Encephalitis Virus.Vaccines (Basel). 2021 Jun 17;9(6):664. doi: 10.3390/vaccines9060664. Vaccines (Basel). 2021. PMID: 34204532 Free PMC article.
-
Whole-Inactivated Influenza Virus Is a Potent Adjuvant for Influenza Peptides Containing CD8+ T Cell Epitopes.Front Immunol. 2018 Mar 14;9:525. doi: 10.3389/fimmu.2018.00525. eCollection 2018. Front Immunol. 2018. PMID: 29593747 Free PMC article.
-
Determining Equine Influenza Virus Vaccine Efficacy-The Specific Contribution of Strain Versus Other Vaccine Attributes.Vaccines (Basel). 2020 Sep 3;8(3):501. doi: 10.3390/vaccines8030501. Vaccines (Basel). 2020. PMID: 32899189 Free PMC article.
-
Immunogenicity and reactogenicity after heterologous prime-boost vaccination with CoronaVac and ChAdox1 nCov-19 (AZD1222) vaccines.Hum Vaccin Immunother. 2022 Nov 30;18(5):2052525. doi: 10.1080/21645515.2022.2052525. Epub 2022 Mar 24. Hum Vaccin Immunother. 2022. PMID: 35323079 Free PMC article.
-
Better Pandemic Influenza Preparedness through Adjuvant Technology Transfer: Challenges and Lessons Learned.Vaccines (Basel). 2021 May 5;9(5):461. doi: 10.3390/vaccines9050461. Vaccines (Basel). 2021. PMID: 34063131 Free PMC article. Review.
References
-
- Pulendran B. Modulating vaccine responses with dendritic cells and toll-like receptors. Immunol Rev. 2004; 199: 227–250. - PubMed
Publication types
MeSH terms
Substances
LinkOut - more resources
Full Text Sources
Other Literature Sources
Medical
Research Materials

