

Estimating the In Vivo Killing Efficacy of Cytotoxic T Lymphocytes across Different Peptide-MHC Complex Densities
- PMID: 25933039
- PMCID: PMC4416789
- DOI: 10.1371/journal.pcbi.1004178
Estimating the In Vivo Killing Efficacy of Cytotoxic T Lymphocytes across Different Peptide-MHC Complex Densities
Abstract
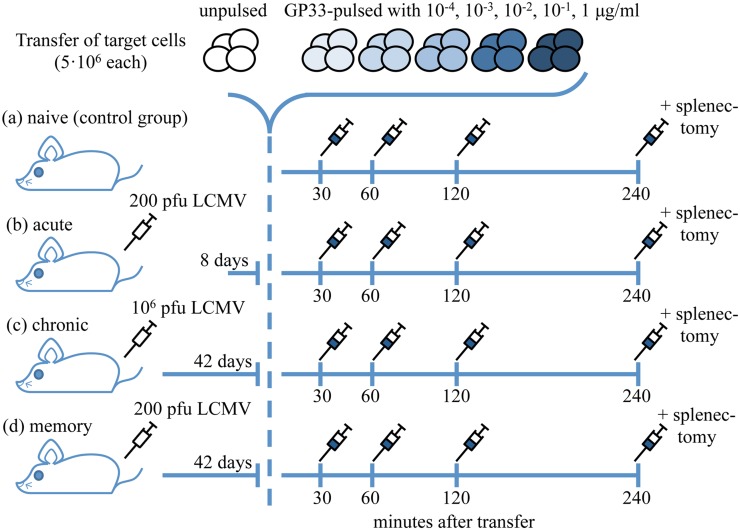
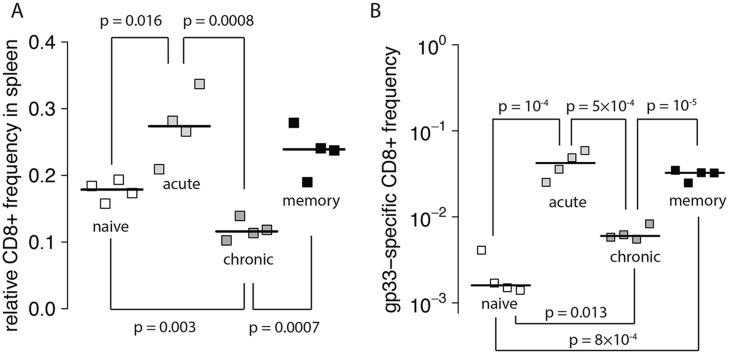
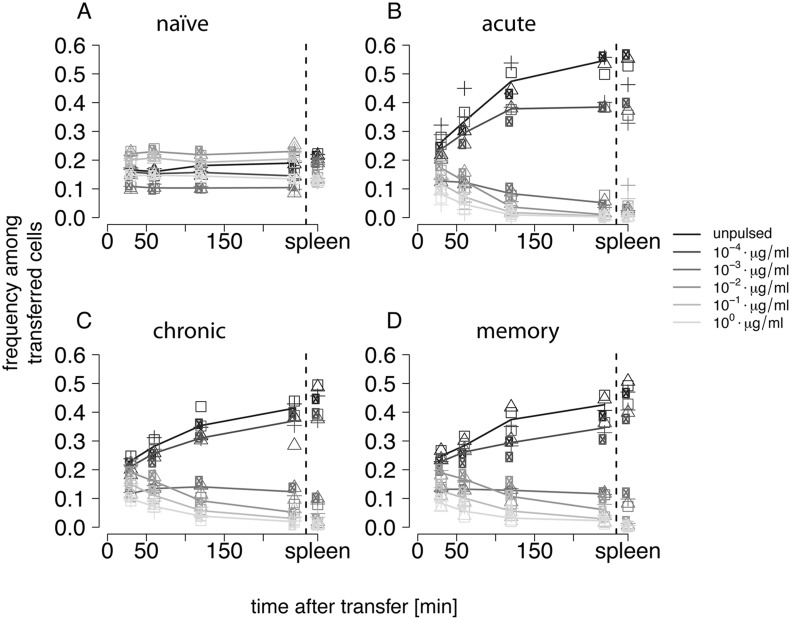
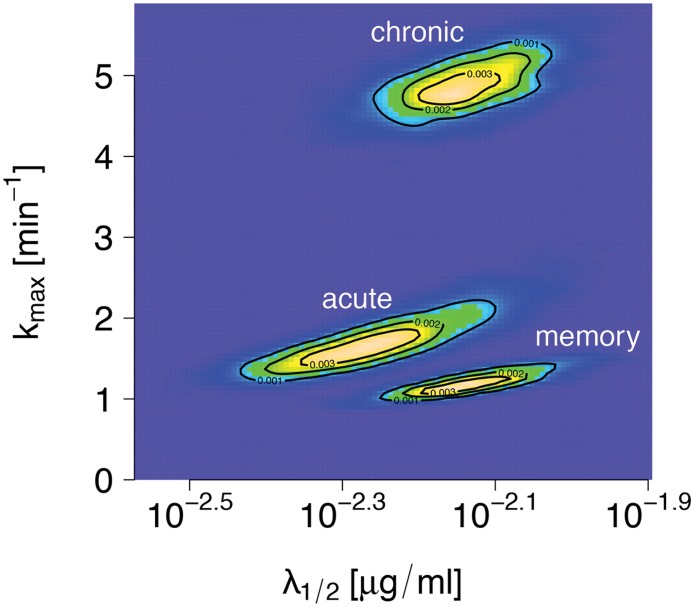
Cytotoxic T lymphocytes (CTLs) are important agents in the control of intracellular pathogens, which specifically recognize and kill infected cells. Recently developed experimental methods allow the estimation of the CTL's efficacy in detecting and clearing infected host cells. One method, the in vivo killing assay, utilizes the adoptive transfer of antigen displaying target cells into the bloodstream of mice. Surprisingly, killing efficacies measured by this method are often much higher than estimates obtained by other methods based on, for instance, the dynamics of escape mutations. In this study, we investigated what fraction of this variation can be explained by differences in peptide loads employed in in vivo killing assays. We addressed this question in mice immunized with lymphocytic choriomeningitis virus (LCMV). We conducted in vivo killing assays varying the loads of the immunodominant epitope GP33 on target cells. Using a mathematical model, we determined the efficacy of effector and memory CTL, as well as CTL in chronically infected mice. We found that the killing efficacy is substantially reduced at lower peptide loads. For physiological peptide loads, our analysis predicts more than a factor 10 lower CTL efficacies than at maximum peptide loads. Assuming that the efficacy scales linearly with the frequency of CTL, a clear hierarchy emerges among the groups across all peptide antigen concentrations. The group of mice with chronic LCMV infections shows a consistently higher killing efficacy per CTL than the acutely infected mouse group, which in turn has a consistently larger efficacy than the memory mouse group. We conclude that CTL killing efficacy dependence on surface epitope frequencies can only partially explain the variation in in vivo killing efficacy estimates across experimental methods and viral systems, which vary about four orders of magnitude. In contrast, peptide load differences can explain at most two orders of magnitude.
Conflict of interest statement
The authors have declared that no competing interests exist.
Figures


Similar articles
-
In vivo treatment with a MHC class I-restricted blocking peptide can prevent virus-induced autoimmune diabetes.J Immunol. 1998 Nov 1;161(9):5087-96. J Immunol. 1998. PMID: 9794447
-
A protective cytotoxic T cell response to a subdominant epitope is influenced by the stability of the MHC class I/peptide complex and the overall spectrum of viral peptides generated within infected cells.Eur J Immunol. 1998 Oct;28(10):3301-11. doi: 10.1002/(SICI)1521-4141(199810)28:10<3301::AID-IMMU3301>3.0.CO;2-Q. Eur J Immunol. 1998. PMID: 9808199
-
Identification of Db- and Kb-restricted subdominant cytotoxic T-cell responses in lymphocytic choriomeningitis virus-infected mice.Virology. 1998 Jan 5;240(1):158-67. doi: 10.1006/viro.1997.8934. Virology. 1998. PMID: 9448700
-
Viral escape from the neutralizing antibody response: the lymphocytic choriomeningitis virus model.Immunogenetics. 2001 Apr;53(3):185-9. doi: 10.1007/s002510100314. Immunogenetics. 2001. PMID: 11398962 Review.
-
Hierarchies of antigen-specific cytotoxic T-cell responses.Immunol Rev. 1998 Aug;164:29-36. doi: 10.1111/j.1600-065x.1998.tb01205.x. Immunol Rev. 1998. PMID: 9795761 Review.
Cited by
-
Understanding Experimental LCMV Infection of Mice: The Role of Mathematical Models.J Immunol Res. 2015;2015:739706. doi: 10.1155/2015/739706. Epub 2015 Oct 21. J Immunol Res. 2015. PMID: 26576439 Free PMC article. Review.
-
Large Variations in HIV-1 Viral Load Explained by Shifting-Mosaic Metapopulation Dynamics.PLoS Biol. 2016 Oct 5;14(10):e1002567. doi: 10.1371/journal.pbio.1002567. eCollection 2016 Oct. PLoS Biol. 2016. PMID: 27706164 Free PMC article.
-
Loss of p14 diminishes immunogenicity in melanoma via non-canonical Wnt signaling by reducing the peptide surface density.Mol Oncol. 2024 Oct;18(10):2449-2470. doi: 10.1002/1878-0261.13660. Epub 2024 May 28. Mol Oncol. 2024. PMID: 38807304 Free PMC article.
-
Exhausted CD8+ T cells exhibit low and strongly inhibited TCR signaling during chronic LCMV infection.Nat Commun. 2020 Sep 8;11(1):4454. doi: 10.1038/s41467-020-18256-4. Nat Commun. 2020. PMID: 32901001 Free PMC article.
-
Facts and Hopes in Immunotherapy Strategies Targeting Antigens Derived from KRAS Mutations.Clin Cancer Res. 2024 May 15;30(10):2017-2024. doi: 10.1158/1078-0432.CCR-23-1212. Clin Cancer Res. 2024. PMID: 38266167 Free PMC article. Review.
References
-
- Fernandez CS, Stratov I, De Rose R, Walsh K, Dale CJ, Smith MZ, et al. Rapid viral escape at an immunodominant simian-human immunodeficiency virus cytotoxic T-lymphocyte epitope exacts a dramatic fitness cost. Journal of Virology. 2005. May;79(9):5721–5731 10.1128/JVI.79.9.5721-5731.2005 . - DOI - PMC - PubMed
Publication types
MeSH terms
Substances
LinkOut - more resources
Full Text Sources
Other Literature Sources
Research Materials
