. 2015 May 1;10(5):e0125795.
doi: 10.1371/journal.pone.0125795. eCollection 2015.

Predicting human genetic interactions from cancer genome evolution

Affiliations

Predicting human genetic interactions from cancer genome evolution

Xiaowen Lu et al. PLoS One. .

Abstract

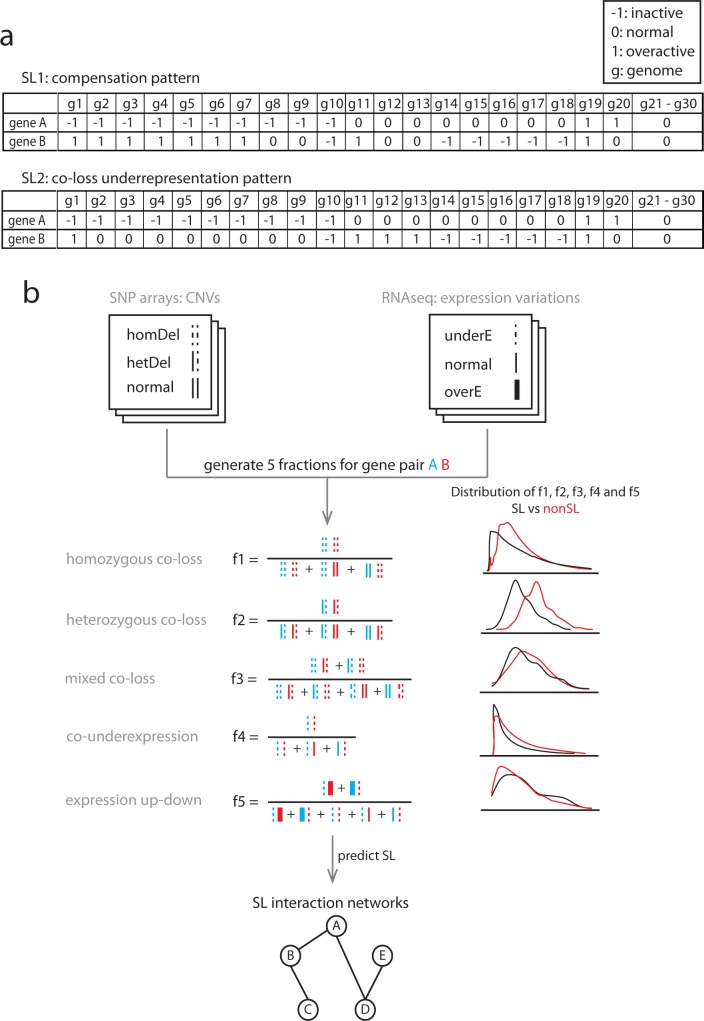
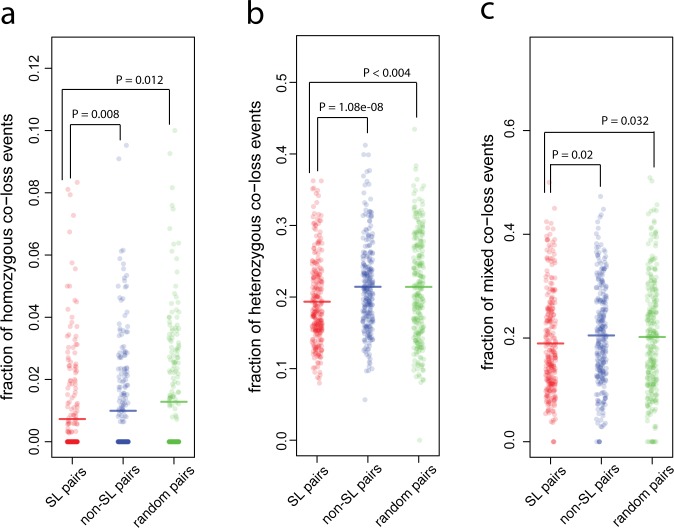
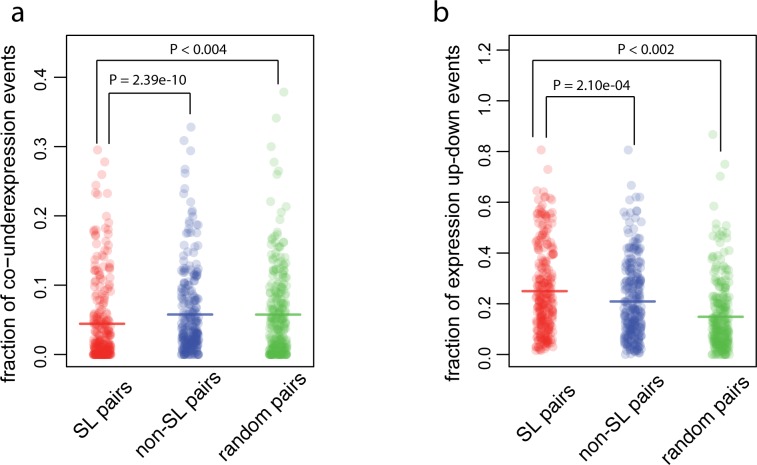
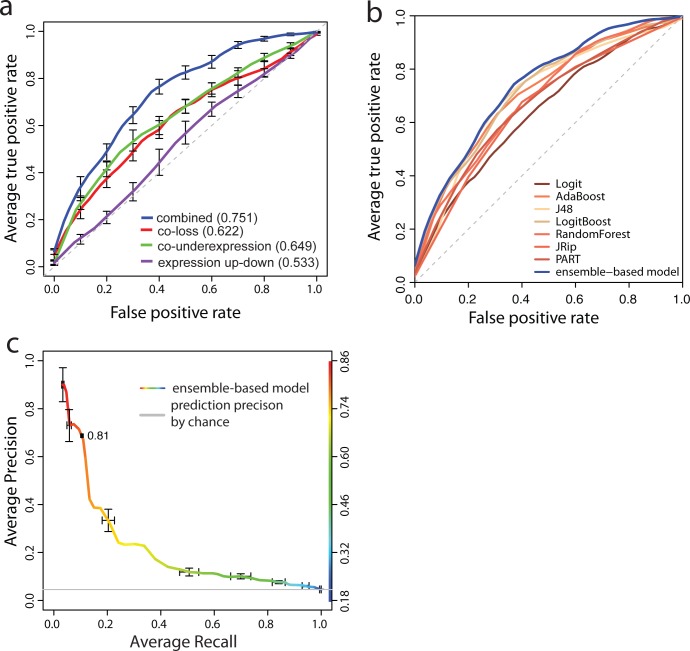
Synthetic Lethal (SL) genetic interactions play a key role in various types of biological research, ranging from understanding genotype-phenotype relationships to identifying drug-targets against cancer. Despite recent advances in empirical measuring SL interactions in human cells, the human genetic interaction map is far from complete. Here, we present a novel approach to predict this map by exploiting patterns in cancer genome evolution. First, we show that empirically determined SL interactions are reflected in various gene presence, absence, and duplication patterns in hundreds of cancer genomes. The most evident pattern that we discovered is that when one member of an SL interaction gene pair is lost, the other gene tends not to be lost, i.e. the absence of co-loss. This observation is in line with expectation, because the loss of an SL interacting pair will be lethal to the cancer cell. SL interactions are also reflected in gene expression profiles, such as an under representation of cases where the genes in an SL pair are both under expressed, and an over representation of cases where one gene of an SL pair is under expressed, while the other one is over expressed. We integrated the various previously unknown cancer genome patterns and the gene expression patterns into a computational model to identify SL pairs. This simple, genome-wide model achieves a high prediction power (AUC = 0.75) for known genetic interactions. It allows us to present for the first time a comprehensive genome-wide list of SL interactions with a high estimated prediction precision, covering up to 591,000 gene pairs. This unique list can potentially be used in various application areas ranging from biotechnology to medical genetics.


Conflict of interest statement

Competing Interests: The authors have declared that no competing interests exist.

Figures

Fig 1
Fig 1. Patterns across cancer genomes reflecting selection against gene co-inactivation, and the workflow to predict SL interactions.
(a) A SL interaction SL1 between gene A and B can show a ‘compensation’ pattern across cancer genomes in which it is more likely that when A is inactive (denoted by -1), B is overactive (denoted by 1) to compensate the inactive A (genomes 1–10), compared to when A is active (genomes 11–30). SL interaction SL2 can, show a ‘co-loss underrepresentation’ in which a combined loss of A and B (denoted by -1 and -1, genome 10) across cancer genomes is underrepresented compared to a loss of either one of the two (genomes 2–9 and genome 14–18). Note that SL1 can also be identified via the co-loss underrepresentation pattern, but the SL2 can only be identified via the co-loss underrepresentation pattern. (b) The model requires two types of data as input, i) CNVs measured by SNP arrays and ii) gene expression variations measured by RNAseq. In CNVs, the status of a gene can be a homozygous deletion (two dash lines), a heterozygous deletion (one dash and one solid line) or normal (two solid lines). For CNVs, we generated three fractions to quantify the likelihood that a gene pair has a homozygous co-loss (f1), a heterozygous co-loss (f2) or a mixed co-loss (f3) event. In gene expression variations, a gene can be under-expressed (one dash line), normal (one solid line) or over-expressed (one bold line). For expression status, we generated two fractions, f4 and f5. f4 is the likelihood that both genes in a gene pair are under-expressed. f5 is the likelihood that a gene pair has an expression up-down event where one is over-expressed while the other one is under-expressed. All these five fractions showed a distribution difference between SL and non-SL pairs. By integrating these five fractions into a prediction model, we can identify SL interactions that can be presented as a network.
Fig 2
Fig 2. SL pairs are reflected in copy number variations.
SL pairs are less likely to have (a) homozygous co-loss events, (b) heterozygous co-loss events and (c) mixed co-loss events than non-SL pairs or random pairs. The fractions for these three types of co-loss events are described as f1, f2, f3 in Methods and Fig 1. Each dot is the fraction for a given pair and the horizontal bar represents the mean of the fractions. P-values for the comparison between SL and non-SL pairs were calculated using one-sided Wilcoxon rank test. P-values for the comparison between SL and random pairs were calculated from 1000 randomizations. P-values were adjusted for multiple comparisons using the Bonferroni correction (see details in Methods).
Fig 3
Fig 3. SL pairs are reflected in gene expression variations.
(a) SL pairs are less likely to be co-underexpressed relative to the control i.e., non-SL or random pairs. The fraction for co-underexpression events is described as f4 in methods and Fig 1. (b) SL pairs are more likely to have expression up-down events where one gene is over-expressed while the other in under-expressed. The fraction for such pattern is described as f5 in Methods and Fig 1. Each dot is the fraction for a given pair and the horizontal bar represents the mean of the fractions. P-values for the comparison between SL and non-SL pairs were calculated with a one-sided Wilcoxon rank test. P-values for the comparison between SL and random pairs were calculated from 1000 randomizations. P-values were adjusted for multiple comparisons using the Bonferroni correction (for details see Methods).
Fig 4
Fig 4. Receiver operating characteristic (ROC) curves.
(a) The ensemble-based prediction model based on all five combined patterns has an area under curve (AUC) of 0.75 (blue line), which is estimated by 10-fold cross validation. Ensemble-based prediction models based on the non-combined individual patterns, i.e., co-loss in CNVs, co-underexpression and expression up-down, are shown in red, green and purple respectively, and have lower AUCs. Standard error bars are added to each ROC. (b) The ensemble-based prediction model (the blue ROC curve) has a better performance than all the seven single. (c) The precision and recall curve is estimated from 10-fold cross validation. Standard error bars are added. The curve is colored according to the cutoff of probability. The color panel of the probability is plotted at the right side. The cutoffs of probability scores (p(x)), 0.81, are printed at the corresponding curve positions. The grey line represents the prediction precision by chance alone.

References

    1. Hartman JL, Garvik B, Hartwell L. Principles for the Buffering of Genetic Variation. Science. 2001;291(5506):1001–4. 10.1126/science.1056072 - DOI - PubMed
    1. Hermisson J, Wagner GnP. The Population Genetic Theory of Hidden Variation and Genetic Robustness. Genetics. 2004;168(4):2271–84. 10.1534/genetics.104.029173 - DOI - PMC - PubMed
    1. Zuk O, Hechter E, Sunyaev SR, Lander ES. The mystery of missing heritability: Genetic interactions create phantom heritability. Proc Natl Acad Sci U S A. 2012. 10.1073/pnas.1119675109 - DOI - PMC - PubMed
    1. Bloom JS, Ehrenreich IM, Loo WT, Lite T-LV, Kruglyak L. Finding the sources of missing heritability in a yeast cross. Nature. 2013;494(7436):234–7. 10.1038/nature11867 - DOI - PMC - PubMed
    1. Hemani G, Shakhbazov K, Westra H-J, Esko T, Henders AK, McRae AF, et al. Detection and replication of epistasis influencing transcription in humans. Nature. 2014;508(7495):249–53. 10.1038/nature13005 - DOI - PMC - PubMed

Publication types

LinkOut - more resources