

A Rapid Embryonic Stem Cell-Based Mouse Model for B-cell Lymphomas Driven by Epstein-Barr Virus Protein LMP1
- PMID: 25934172
- PMCID: PMC4456688
- DOI: 10.1158/2326-6066.CIR-15-0058
A Rapid Embryonic Stem Cell-Based Mouse Model for B-cell Lymphomas Driven by Epstein-Barr Virus Protein LMP1
Abstract
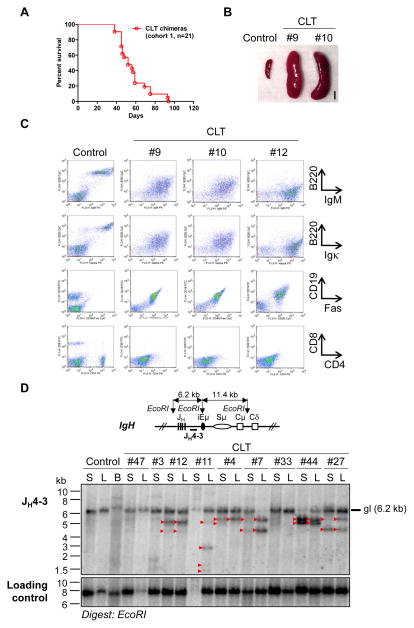
The Epstein-Barr virus (EBV) latent membrane protein 1 (LMP1) contributes to oncogenic human B-cell transformation. Mouse B cells conditionally expressing LMP1 are not predisposed to B-cell malignancies, as LMP1-expressing B cells are eliminated by T cells. However, mice with conditional B-cell LMP1 expression and genetic elimination of α/β and γ/δ T cells ("CLT" mice) die early in association with B-cell lymphoproliferation and lymphomagenesis. Generation of CLT mice involves in-breeding multiple independently segregating alleles. Thus, although introduction of additional activating or knockout mutations into the CLT model is desirable for further B-cell expansion and immunosurveillance studies, doing such experiments by germline breeding is time-consuming, expensive, and sometimes unfeasible. To generate a more tractable model, we generated clonal CLT embryonic stem (ES) cells from CLT embryos and injected them into RAG2-deficient blastocysts to generate chimeric mice, which, like germline CLT mice, harbor splenic CLT B cells and lack T cells. CLT chimeric mice generated by this RAG2-deficient blastocyst complementation ("RDBC") approach die rapidly in association with B-cell lymphoproliferation and lymphoma. Because CLT lymphomas routinely express the activation-induced cytidine deaminase (AID) antibody diversifier, we tested potential AID roles by eliminating the AID gene in CLT ES cells and testing them via RDBC. We found that CLT and AID-deficient CLT ES chimeras had indistinguishable phenotypes, showing that AID is not essential for LMP1-induced lymphomagenesis. Beyond expanding accessibility and utility of CLT mice as a cancer immunotherapy model, our studies provide a new approach for facilitating generation of genetically complex mouse cancer models.
©2015 American Association for Cancer Research.
Figures


Similar articles
-
Functional interplay of Epstein-Barr virus oncoproteins in a mouse model of B cell lymphomagenesis.Proc Natl Acad Sci U S A. 2020 Jun 23;117(25):14421-14432. doi: 10.1073/pnas.1921139117. Epub 2020 Jun 10. Proc Natl Acad Sci U S A. 2020. PMID: 32522871 Free PMC article.
-
LMP1-deficient Epstein-Barr virus mutant requires T cells for lymphomagenesis.J Clin Invest. 2015 Jan;125(1):304-15. doi: 10.1172/JCI76357. Epub 2014 Dec 8. J Clin Invest. 2015. PMID: 25485679 Free PMC article.
-
Immune surveillance and therapy of lymphomas driven by Epstein-Barr virus protein LMP1 in a mouse model.Cell. 2012 Feb 17;148(4):739-51. doi: 10.1016/j.cell.2011.12.031. Cell. 2012. PMID: 22341446 Free PMC article.
-
Latent Membrane Protein 1 (LMP1) and LMP2A Collaborate To Promote Epstein-Barr Virus-Induced B Cell Lymphomas in a Cord Blood-Humanized Mouse Model but Are Not Essential.J Virol. 2017 Mar 13;91(7):e01928-16. doi: 10.1128/JVI.01928-16. Print 2017 Apr 1. J Virol. 2017. PMID: 28077657 Free PMC article.
-
Epstein-Barr Virus LMP1-Mediated Oncogenicity.J Virol. 2017 Oct 13;91(21):e01718-16. doi: 10.1128/JVI.01718-16. Print 2017 Nov 1. J Virol. 2017. PMID: 28835489 Free PMC article. Review.
Cited by
-
Mouse Models of Germinal Center Derived B-Cell Lymphomas.Front Immunol. 2021 Aug 12;12:710711. doi: 10.3389/fimmu.2021.710711. eCollection 2021. Front Immunol. 2021. PMID: 34456919 Free PMC article. Review.
-
Neural blastocyst complementation enables mouse forebrain organogenesis.Nature. 2018 Nov;563(7729):126-130. doi: 10.1038/s41586-018-0586-0. Epub 2018 Oct 10. Nature. 2018. PMID: 30305734 Free PMC article.
References
-
- Kutok JL, Wang F. Spectrum of Epstein-Barr virus-associated diseases. Annu Rev Pathol. 2006;1:375–404. - PubMed
-
- Hislop AD, Taylor GS, Sauce D, Rickinson AB. Cellular responses to viral infection in humans: lessons from Epstein-Barr virus. Annu Rev Immunol. 2007;25:587–617. - PubMed
-
- Klein E, Nagy N, Rasul E. Modification of Cell Differentiation, One of the Mechanisms in the Surveillance of Malignancy. Cancer Immunol Res. 2015;3:97–102. - PubMed
-
- Uchida J, Yasui T, Takaoka-Shichijo Y, Muraoka M, Kulwichit W, Raab-Traub N, et al. Mimicry of CD40 signals by Epstein-Barr virus LMP1 in B lymphocyte responses. Science. 1999;286:300–3. - PubMed
Publication types
MeSH terms
Substances
Grants and funding
LinkOut - more resources
Full Text Sources
Research Materials
