. 2015 Jun 19;290(25):15835-15854.
doi: 10.1074/jbc.M114.627356. Epub 2015 May 1.

Identification of Distinct Conformations of the Angiotensin-II Type 1 Receptor Associated with the Gq/11 Protein Pathway and the β-Arrestin Pathway Using Molecular Dynamics Simulations

Affiliations

Identification of Distinct Conformations of the Angiotensin-II Type 1 Receptor Associated with the Gq/11 Protein Pathway and the β-Arrestin Pathway Using Molecular Dynamics Simulations

Jérôme Cabana et al. J Biol Chem. .

Abstract

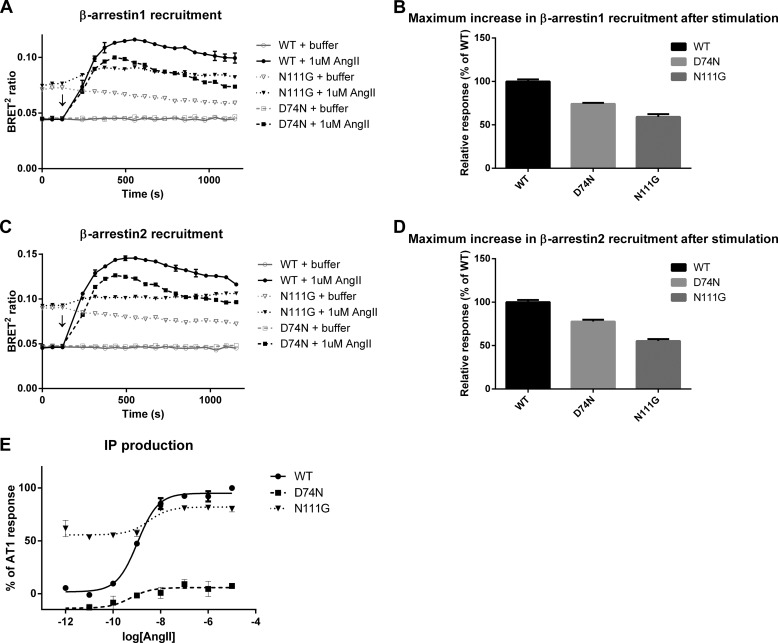
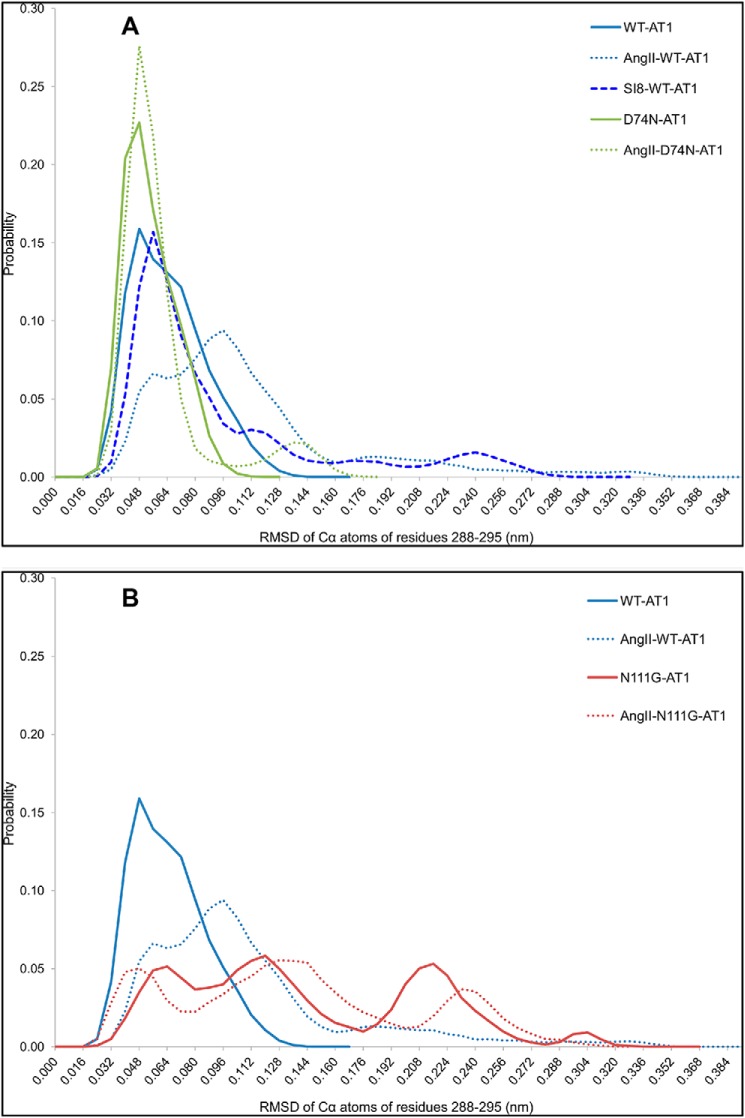
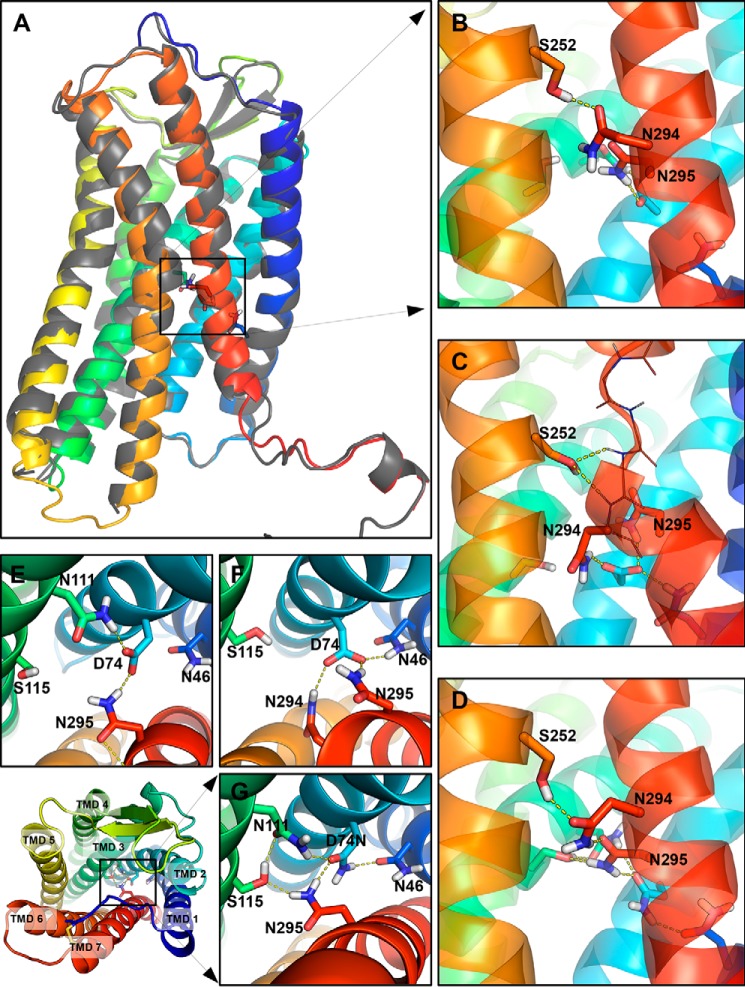
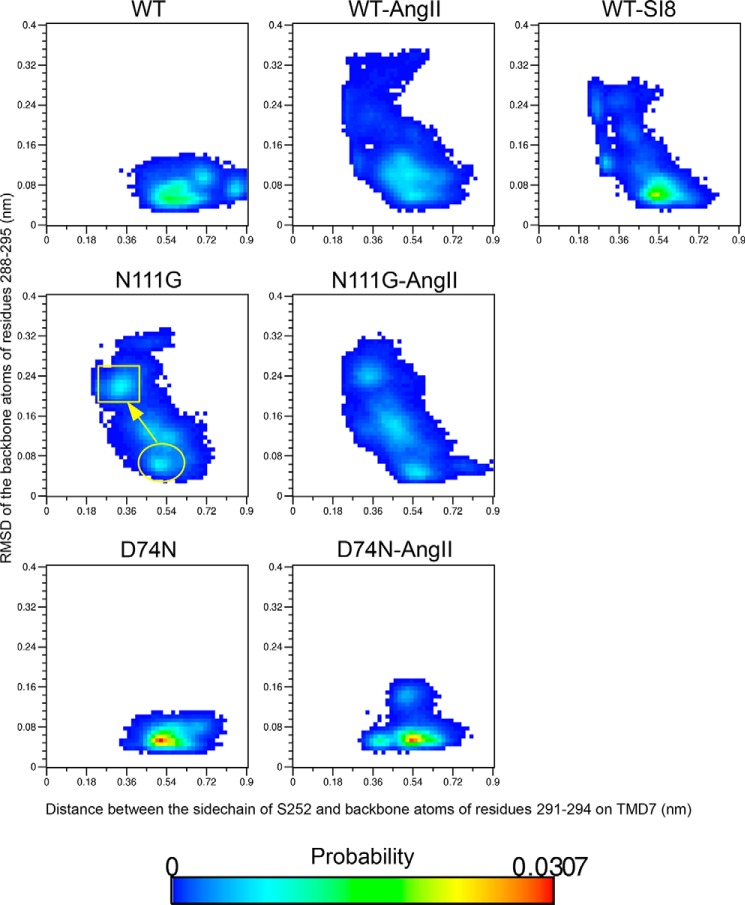
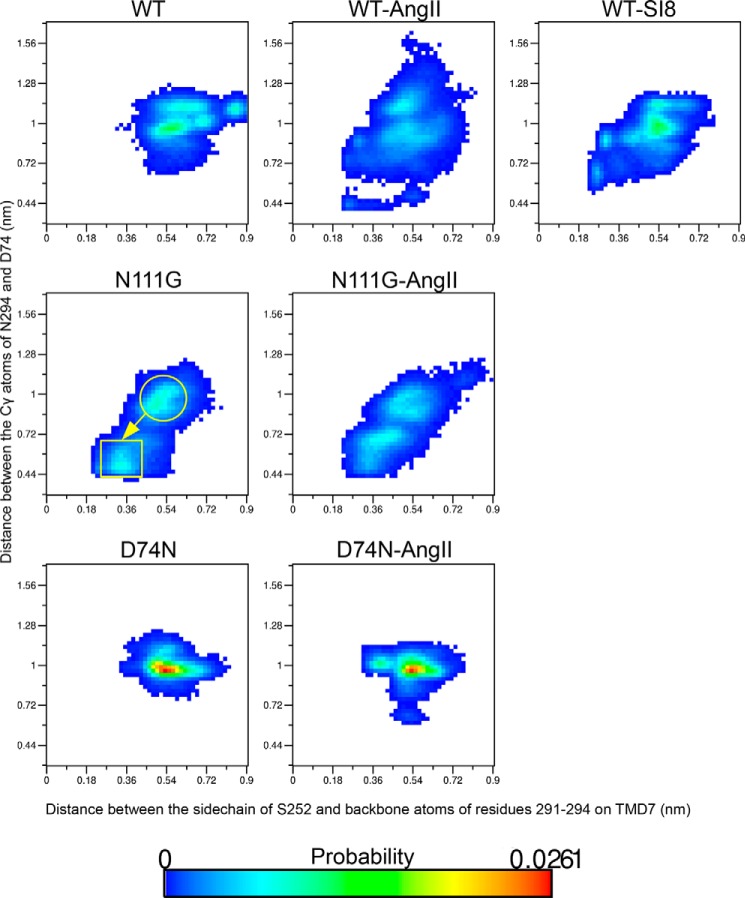
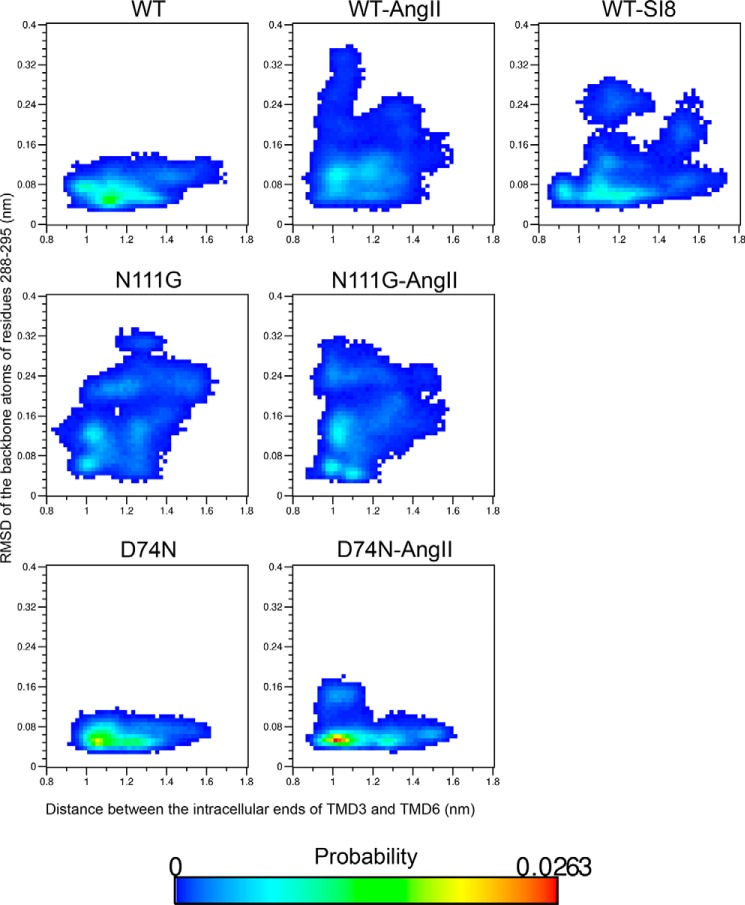
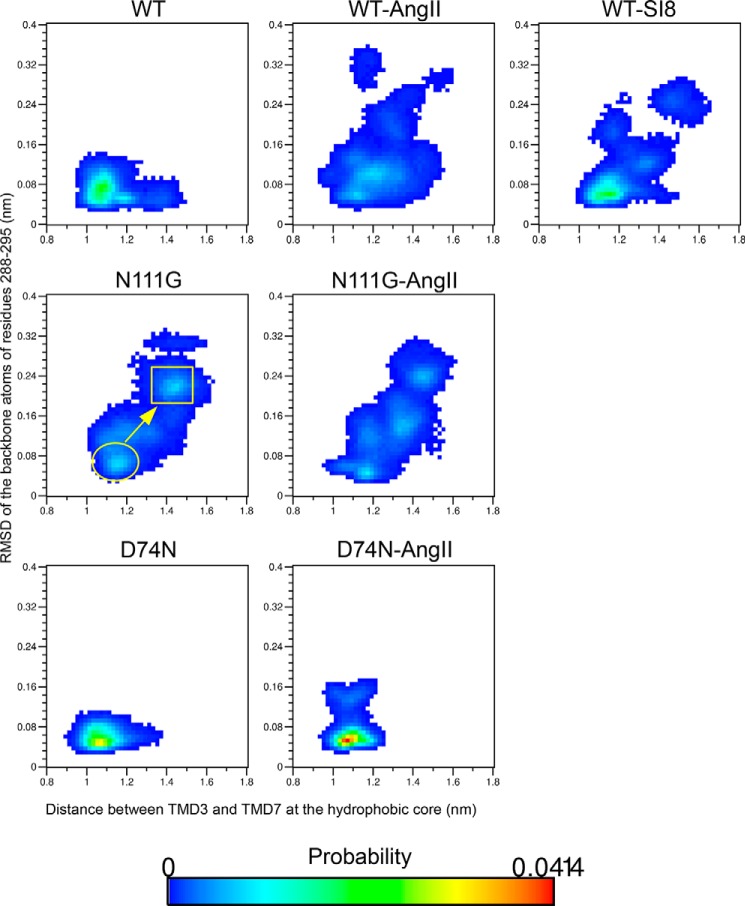
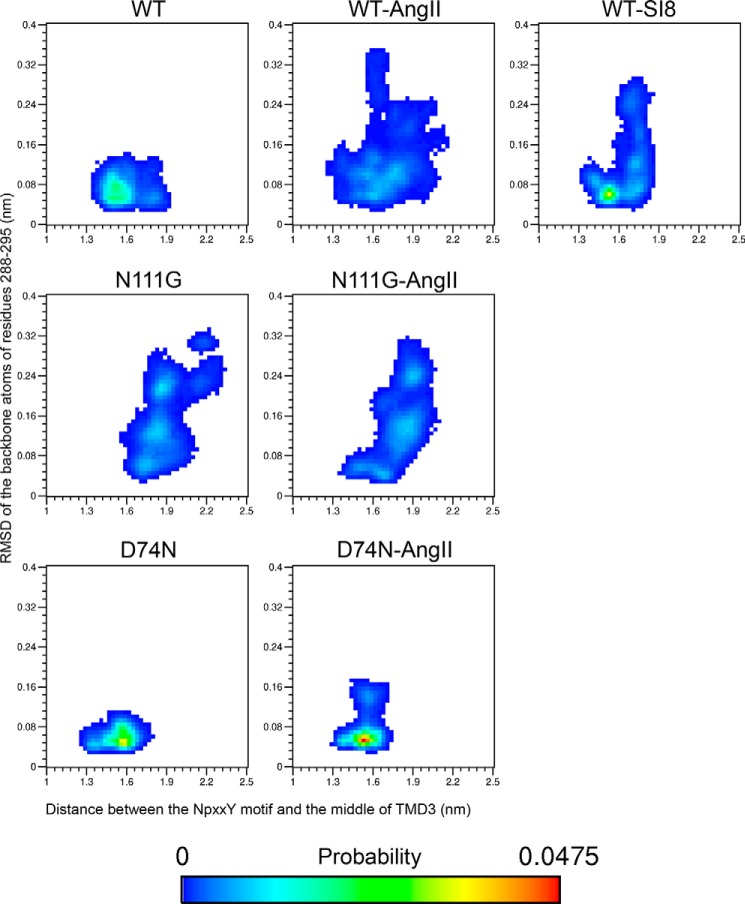
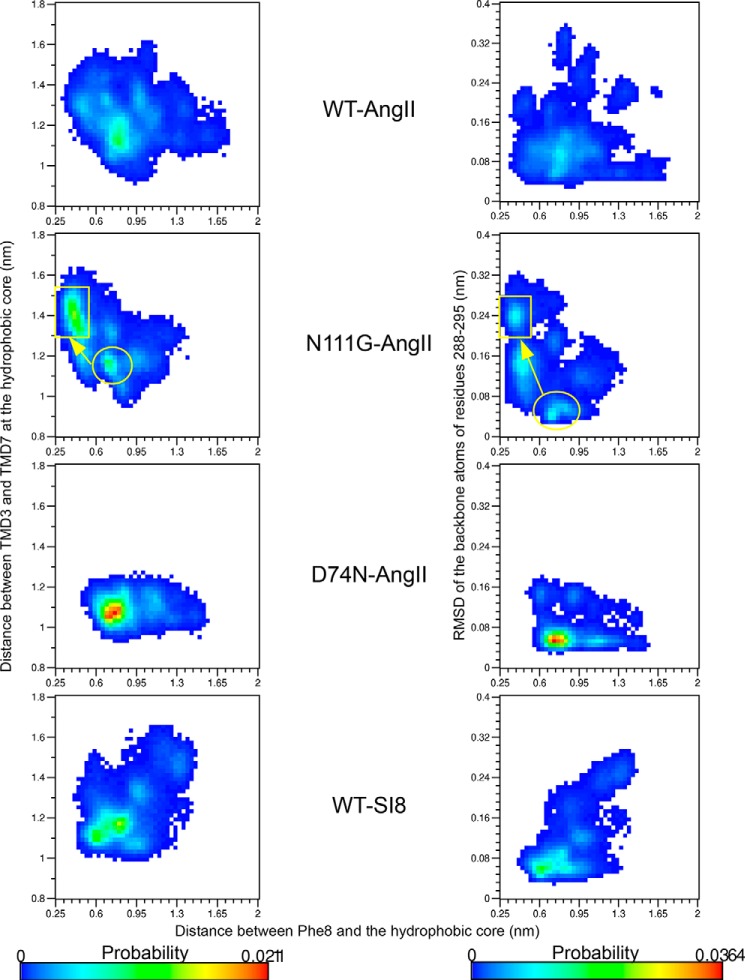
Biased signaling represents the ability of G protein-coupled receptors to engage distinct pathways with various efficacies depending on the ligand used or on mutations in the receptor. The angiotensin-II type 1 (AT1) receptor, a prototypical class A G protein-coupled receptor, can activate various effectors upon stimulation with the endogenous ligand angiotensin-II (AngII), including the Gq/11 protein and β-arrestins. It is believed that the activation of those two pathways can be associated with distinct conformations of the AT1 receptor. To verify this hypothesis, microseconds of molecular dynamics simulations were computed to explore the conformational landscape sampled by the WT-AT1 receptor, the N111G-AT1 receptor (constitutively active and biased for the Gq/11 pathway), and the D74N-AT1 receptor (biased for the β-arrestin1 and -2 pathways) in their apo-forms and in complex with AngII. The molecular dynamics simulations of the AngII-WT-AT1, N111G-AT1, and AngII-N111G-AT1 receptors revealed specific structural rearrangements compared with the initial and ground state of the receptor. Simulations of the D74N-AT1 receptor revealed that the mutation stabilizes the receptor in the initial ground state. The presence of AngII further stabilized the ground state of the D74N-AT1 receptor. The biased agonist [Sar(1),Ile(8)]AngII also showed a preference for the ground state of the WT-AT1 receptor compared with AngII. These results suggest that activation of the Gq/11 pathway is associated with a specific conformational transition stabilized by the agonist, whereas the activation of the β-arrestin pathway is linked to the stabilization of the ground state of the receptor.

Keywords: AT1 receptor; AT1R; G protein-coupled receptor (GPCR); activation mechanism; angiotensin II; biased signaling; functional selectivity; molecular dynamics; protein conformation; receptor structure-function.


Figures

FIGURE 1.
FIGURE 1.
Signaling properties of the WT-AT1 receptor and the biased mutants on the β-arrestins and inositol phosphate pathways. HEK293 cells were transfected with the indicated receptor, and their recruitment of β-arrestin1 (A), β-arrestin2 (C), and IP1 production (E) was assayed as described under “Experimental Procedures.” Each point represents the mean ± S.D. of duplicate determinations of a typical experiment, which is representative of at least three independent experiments. Bar graphs represent the mean ± S.E. for the maximum increase in β-arrestin1 (B) and β-arrestin2 (D) recruitment relative to the WT-AT1 receptor after normalizing for each receptor's level of expression.
FIGURE 2.
FIGURE 2.
Probability distribution of the r.m.s.d. of the Cα atoms of residues I2887.39 through N2957.46 on TMD7 measured from the MD simulations of each identified receptor. r.m.s.d. was calculated following a superposition of TMD7 in all frames of the MD simulations to ignore rigid body movements of the helix.
FIGURE 3.
FIGURE 3.
Snapshots from the MD simulations showing interactions in the MHN in the Gq-inactive and Gq-active states. A, schematic representation of the backbone of the AT1 receptor homology model produced by the I-TASSER server (colored) closely matches the crystal structure of the CXCR4 receptor (gray). of the residues of the MHN are visible as sticks. B and E, in the WT-AT1 receptor, the side chains of S2526.47 form an H-bond with the side chain of N2947.45. The side chains of N1113.35 and N2957.46 form an H-bond with D742.50. C and F, after the conformational change in the N111G-AT1 receptor, AngII-N111G-AT1 receptor, and AngII-WT-AngII receptor; the side chain of S2526.47 can form H-bonds with backbone amines of Phe293 and Asn294 or the backbone carbonyl of Ala291 (thin line representation) to stabilize the conformational change of TMD7 (red ribbon). The side chain of D742.50 can form H-bonds with the side chains of N2947.45, N2957.46, and N461.50. D and G, in the D74N-AT1 receptor and AngII-D74N-AT1 receptor, interactions are as described for B, but additionally include an H-bond between residue D74N2.50 and N461.50 and between N2957.46 and S1153.39. Transmembrane domains are shown as colored ribbons (TMD1 = dark blue; TMD2 = light blue; TMD3 = aqua; TMD6 = orange, and TMD7 = red). Side chains are show as sticks. Oxygen atoms are red; nitrogen atoms are blue; hydrogen atoms are white, and carbon atoms are colored according to their TMD. H-bonds predicted by PyMOL are shown as yellow dashed lines.
FIGURE 4.
FIGURE 4.
Probability landscape generated by sorting frames of the MD simulations according to two measurements as follows: x axis, distance between the Oγ atom of residue S2526.47 and the center-of-mass of backbone atoms of A2917.42 (carbonyl O), F2937.44 (amine hydrogen) and N2947.45 (amine hydrogen); y axis, r.m.s.d. of the Cα atoms of residues 288–295 on TMD7.
FIGURE 5.
FIGURE 5.
Probability landscape generated by sorting frames of the MD simulations according to two measurements as follows: x axis, distance between the Oγ atom of residue Ser252 and the center-of-mass of backbone atoms of A2917.42 (carbonyl O), F2937.44 (amine hydrogen), and N2947.45 (amine hydrogen); y axis, distance between the Cγ atom of N2947.45 and the Cγ atom of D742.50 (or the mutated D74N).
FIGURE 6.
FIGURE 6.
Probability landscape generated by sorting frames of the MD simulations according to two measurements as follows: x axis, distance between the center-of-mass of backbone atoms of residues S1233.47 to Y1273.51 (intracellular extremity of TMD3) and residues I2386.33 to I2426.37 (intracellular extremity of TMD6); y axis, r.m.s.d. of the Cα atoms of residues I2887.39 through N2957.46 on TMD7.
FIGURE 7.
FIGURE 7.
Probability landscape generated by sorting frames of the MD simulations according to two measurements as follow: x axis, distance between the center-of-mass of backbone atoms of residues V1083.32–L1123.36 (region of the hydrophobic core on TMD3) and residues I2887.39–Y2927.43 (region of the hydrophobic core on TMD7); y axis, r.m.s.d. of the Cα atoms of residues I2887.39 through N2957.46 on TMD7.
FIGURE 8.
FIGURE 8.
Probability landscape generated by sorting frames of the MD simulations according to two measurements as follows: x axis, distance between the center-of-mass of the backbone atoms of residues N1113.35 to S1153.39 (middle of TMD3) and the center-of-mass of the backbone atoms of residues N2987.49 to Y3027.53 (NPXXY motif), y axis, r.m.s.d. of the Cα atoms of residues I2887.39 through N2957.46 on TMD7.
FIGURE 9.
FIGURE 9.
Snapshots from MD simulations showing different SAS of the Y3027.53 side chain from the NPXXY motif as it is surrounded by hydrophobic side chains. A, buried configuration, with SAS of 0.21 nm2 for Y3027.53. B, a more exposed configuration, with SAS of 0.82 nm2 for Y3027.53.
FIGURE 10.
FIGURE 10.
Probability landscape generated by sorting frames of the MD simulations according to two measurements as follows: x axis, distance between the center-of-mass of the backbone atoms of residues N1113.35 to S1153.39 (middle of TMD3) and the center-of-mass of the backbone atoms of residues N2987.49 to Y3027.53 (NPXXY motif); y axis, solvent-accessible surface of the side chain of residue Y3027.53.
FIGURE 11.
FIGURE 11.
Probability distribution of the distance between the Nδ atom of N2957.46 and the Oγ atom of S1153.39 measured from the MD simulations of each identified receptor.
FIGURE 12.
FIGURE 12.
Snapshot from MD simulations showing common interactions between side chains or the C-terminal carboxyl of AngII and specific sectors of the AT1 receptor. A, side chain of Arg2 forms H-bonds with D2636.58 and D2817.32 at the top of TMD6 and TMD7. B, side chain of Val3 interacts with the hydrophobic side chains of F170ECL2, I172ECL2, F179ECL2, and A181ECL2. C, side chain of His6 is positioned between TMD1, TMD2, and TMD7 and can form H-bonds with Y351.39, Y2927.43, and R1674.64 and also π-stacking interactions with W842.60. D, Ile5 is positioned between TMD1, TMD2, and TMD7 (above His6) and contacts residues I271.31, F281.32, I311.35, T882.64, P2857.36, and I2887.39. E, C-terminal moiety is positioned between TMD3, TMD5, and TMD6 and can form H-bonds with the side chains of residues Y1133.37, K1995.42, N2005.43, H2566.51, Q2576.52, and T2606.55. F, side chain of residue Phe8 is inserted in the open hydrophobic core (observed in certain trajectories from the MD simulations of the N111G-AT1, AngII-N111G-AT1, and AngII-WT-AT1 receptors). G, side chain of Phe8 is adjacent to the closed hydrophobic core (observed in all trajectories). Transmembrane domains are showed as colored ribbons (TMD1 = dark blue; TMD2 = light blue; TMD3 = aqua, TMD4/ECL2 = green; TMD5 = yellow; TMD6 = orange, and TMD7 = red). Angiotensin-II is colored gray. Side chains are shown as sticks for polar interactions and spheres for hydrophobic interactions. Oxygen atoms are red, nitrogen atoms are blue, hydrogen atoms are white and carbon atoms are colored according to their TMD. H-bonds predicted by PyMOL (ranging between 1.7 and 2.6 Å between hydrogen and acceptor) are shown as yellow dashed lines.
FIGURE 13.
FIGURE 13.
Probability landscape generated by sorting frames of the MD simulations according to two measurements as follows: x axis, distance between the center-of-mass of the side chain of residue Phe8 and the center-of-mass of the side chains of residues V1083.32, L1123.36, F772.53, I2887.39, A2917.41, and Y2927.42 of the hydrophobic core; y axis, graphs on the left, distance between the center-of-mass of backbone atoms of residues V10832–L1123.36 (region of the hydrophobic core on TMD3) and residues I2887.39–Y2927.43 (region of the hydrophobic core on TMD7); y-axis, graphs on the right, r.m.s.d. of the Cα atoms of residues I2887.39 through N2957.46 on TMD7.

References

    1. de Gasparo M., Catt K. J., Inagami T., Wright J. W., Unger T. (2000) International union of pharmacology. XXIII. The angiotensin II receptors. Pharmacol. Rev. 52, 415–472 - PubMed
    1. Thomas W. G., Qian H. (2003) Arresting angiotensin type 1 receptors. Trends Endocrinol. Metab. 14, 130–136 - PubMed
    1. Benigni A., Cassis P., Remuzzi G. (2010) Angiotensin II revisited: new roles in inflammation, immunology and aging. EMBO Mol. Med. 2, 247–257 - PMC - PubMed
    1. Bonde M. M., Hansen J. T., Sanni S. J., Haunsø S., Gammeltoft S., Lyngsø C., Hansen J. L. (2010) Biased signaling of the angiotensin II type 1 receptor can be mediated through distinct mechanisms. PLoS ONE 5, e14135. - PMC - PubMed
    1. Aplin M., Bonde M. M., Hansen J. L. (2009) Molecular determinants of angiotensin II type 1 receptor functional selectivity. J. Mol. Cell. Cardiol. 46, 15–24 - PubMed

Publication types

MeSH terms