

Are interventions to promote healthy eating equally effective for all? Systematic review of socioeconomic inequalities in impact
- PMID: 25934496
- PMCID: PMC4423493
- DOI: 10.1186/s12889-015-1781-7
Are interventions to promote healthy eating equally effective for all? Systematic review of socioeconomic inequalities in impact
Erratum in
-
Erratum to: Are interventions to promote healthy eating equally effective for all? Systematic review of socioeconomic inequalities in impact.BMC Public Health. 2015 Sep 15;15:894. doi: 10.1186/s12889-015-2162-y. BMC Public Health. 2015. PMID: 26373840 Free PMC article. No abstract available.
Abstract
Background: Interventions to promote healthy eating make a potentially powerful contribution to the primary prevention of non communicable diseases. It is not known whether healthy eating interventions are equally effective among all sections of the population, nor whether they narrow or widen the health gap between rich and poor. We undertook a systematic review of interventions to promote healthy eating to identify whether impacts differ by socioeconomic position (SEP).
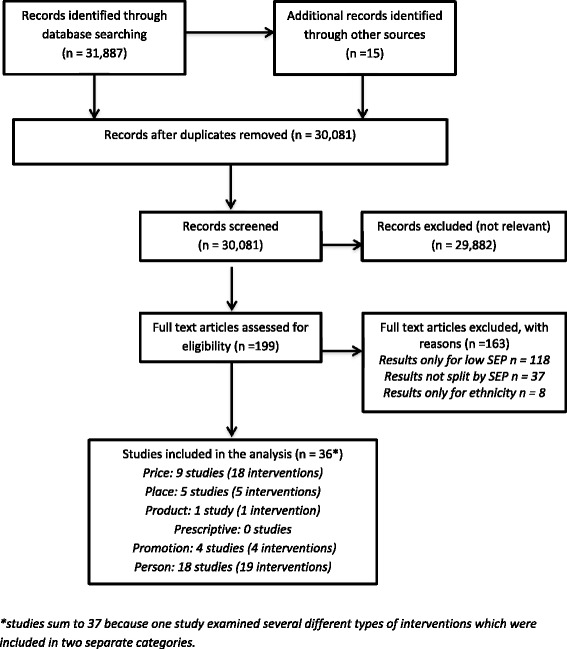
Methods: We searched five bibliographic databases using a pre-piloted search strategy. Retrieved articles were screened independently by two reviewers. Healthier diets were defined as the reduced intake of salt, sugar, trans-fats, saturated fat, total fat, or total calories, or increased consumption of fruit, vegetables and wholegrain. Studies were only included if quantitative results were presented by a measure of SEP. Extracted data were categorised with a modified version of the "4Ps" marketing mix, expanded to 6 "Ps": "Price, Place, Product, Prescriptive, Promotion, and Person".
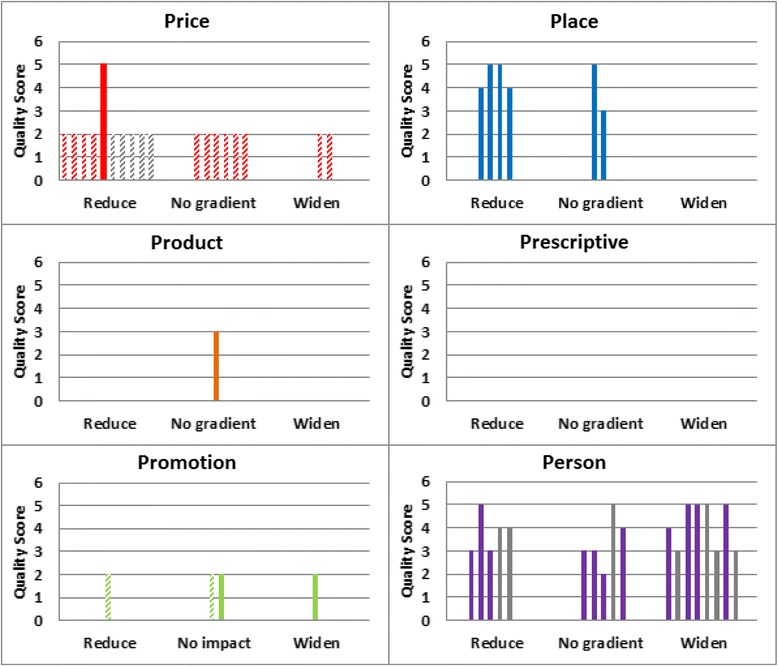
Results: Our search identified 31,887 articles. Following screening, 36 studies were included: 18 "Price" interventions, 6 "Place" interventions, 1 "Product" intervention, zero "Prescriptive" interventions, 4 "Promotion" interventions, and 18 "Person" interventions. "Price" interventions were most effective in groups with lower SEP, and may therefore appear likely to reduce inequalities. All interventions that combined taxes and subsidies consistently decreased inequalities. Conversely, interventions categorised as "Person" had a greater impact with increasing SEP, and may therefore appear likely to reduce inequalities. All four dietary counselling interventions appear likely to widen inequalities. We did not find any "Prescriptive" interventions and only one "Product" intervention that presented differential results and had no impact by SEP. More "Place" interventions were identified and none of these interventions were judged as likely to widen inequalities.
Conclusions: Interventions categorised by a "6 Ps" framework show differential effects on healthy eating outcomes by SEP. "Upstream" interventions categorised as "Price" appeared to decrease inequalities, and "downstream" "Person" interventions, especially dietary counselling seemed to increase inequalities. However the vast majority of studies identified did not explore differential effects by SEP. Interventions aimed at improving population health should be routinely evaluated for differential socioeconomic impact.
Figures
References
-
- World Health Organisation . World Health Statistics 2012. Geneva: WHO; 2012.
-
- Lim SS, Vos T, Flaxman AD, Danaei G, Shibuya K, Adair-Rohani H, et al. A comparative risk assessment of burden of disease and injury attributable to 67 risk factors and risk factor clusters in 21 regions, 1990–2010: a systematic analysis for the Global Burden of Disease Study 2010. Lancet. 2012;380:2224–60. doi: 10.1016/S0140-6736(12)61766-8. - DOI - PMC - PubMed
-
- WHO. Diet. http://www.who.int/dietphysicalactivity/diet/en/(2014). Accessed 01 September 2014.
-
- Nelson M, Erens B, Bates B, Church S, Boshier T. The Low Income Diet and Nutrition Survey. Food Standards Agency 2007. http://tna.europarchive.org/20110116113217/http://www.food.gov.uk/science/dietarysurveys/lidnsbranch/ Accessed 01 September 2014.
Publication types
MeSH terms
Grants and funding
LinkOut - more resources
Full Text Sources
Other Literature Sources
Miscellaneous
