. 2015 May 2:10:13.
doi: 10.1186/s13064-015-0040-z.

The methyl binding domain 3/nucleosome remodelling and deacetylase complex regulates neural cell fate determination and terminal differentiation in the cerebral cortex

Affiliations

The methyl binding domain 3/nucleosome remodelling and deacetylase complex regulates neural cell fate determination and terminal differentiation in the cerebral cortex

Erin Knock et al. Neural Dev. .

Abstract

Background: Chromatin-modifying complexes have key roles in regulating various aspects of neural stem cell biology, including self-renewal and neurogenesis. The methyl binding domain 3/nucleosome remodelling and deacetylation (MBD3/NuRD) co-repressor complex facilitates lineage commitment of pluripotent cells in early mouse embryos and is important for stem cell homeostasis in blood and skin, but its function in neurogenesis had not been described. Here, we show for the first time that MBD3/NuRD function is essential for normal neurogenesis in mice.

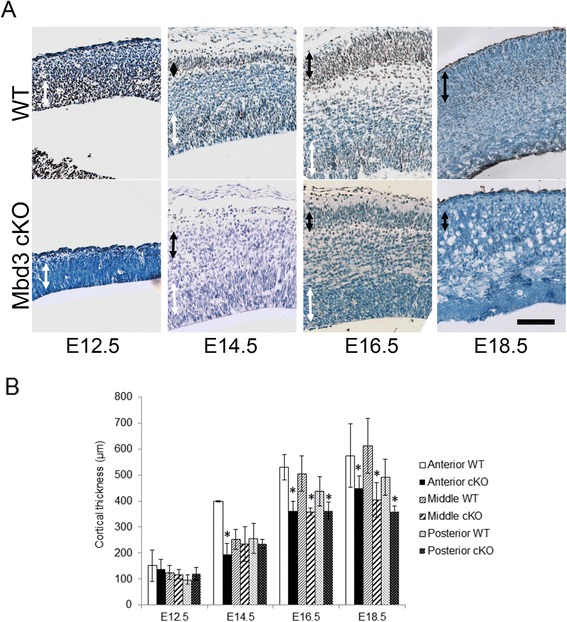
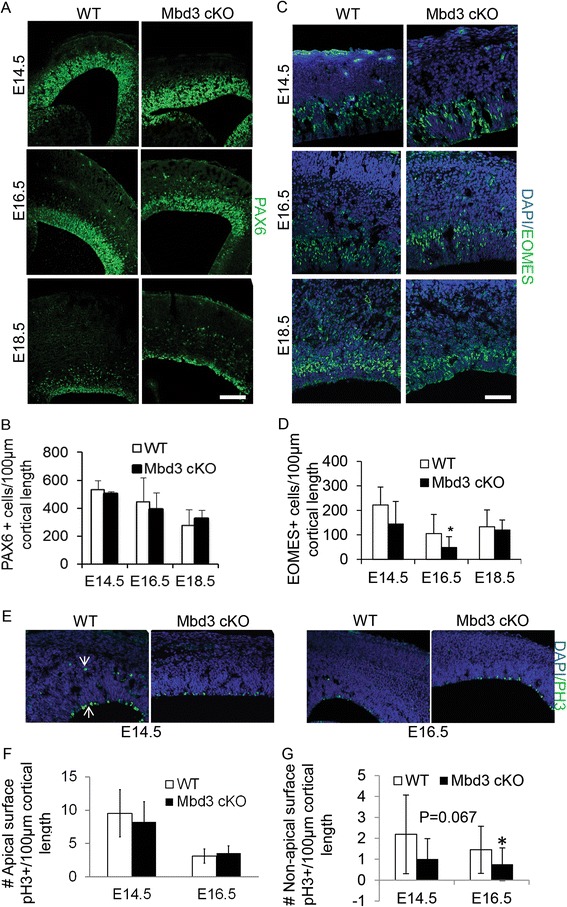
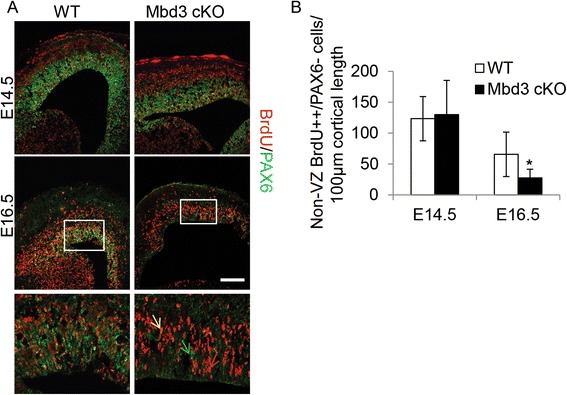
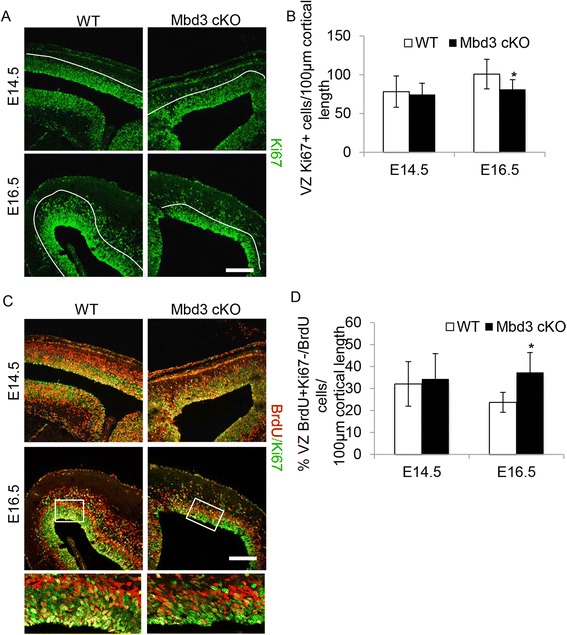
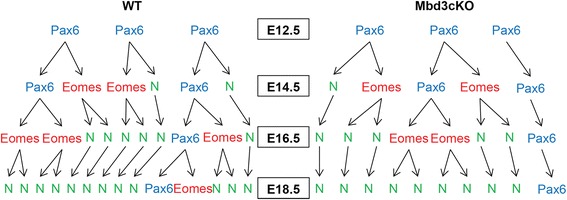
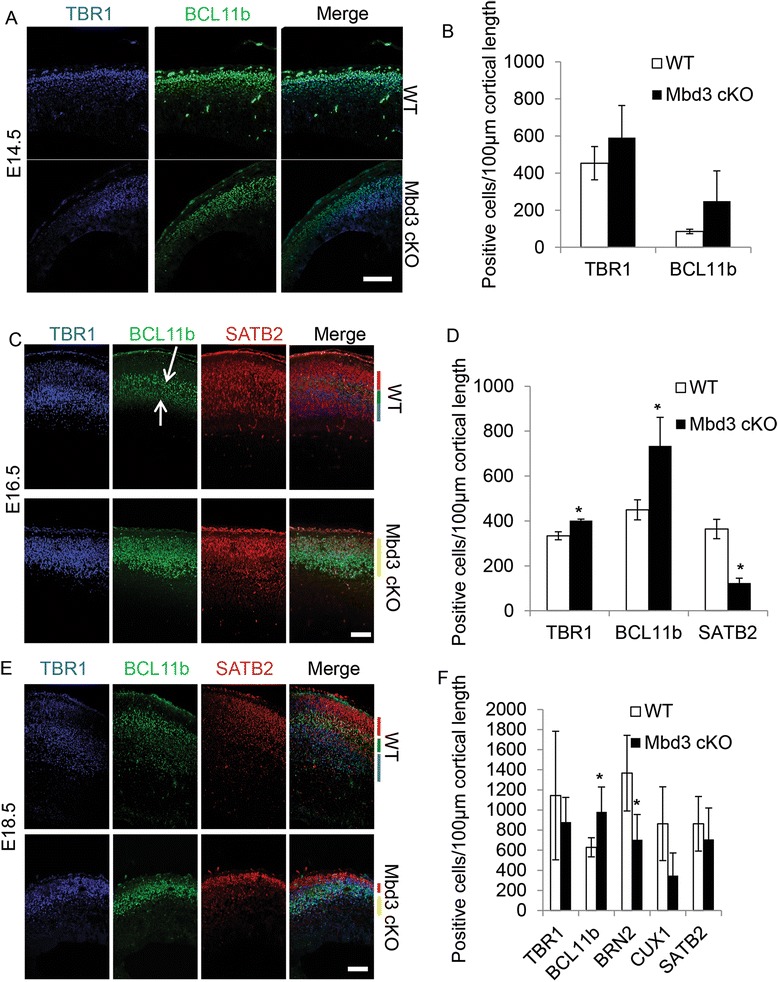
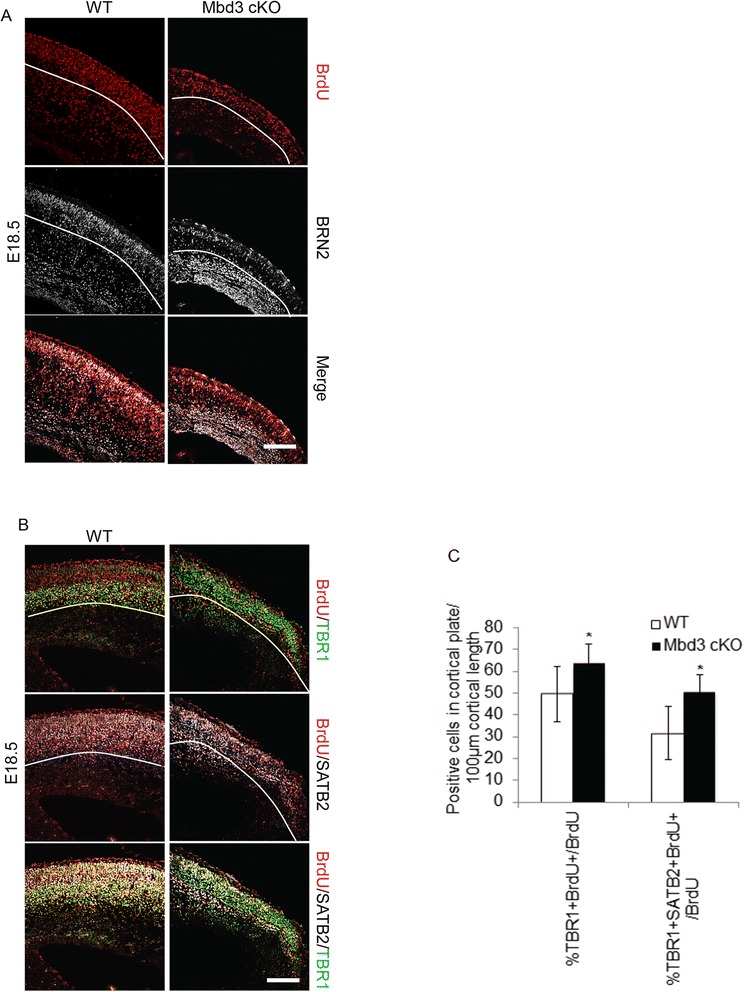
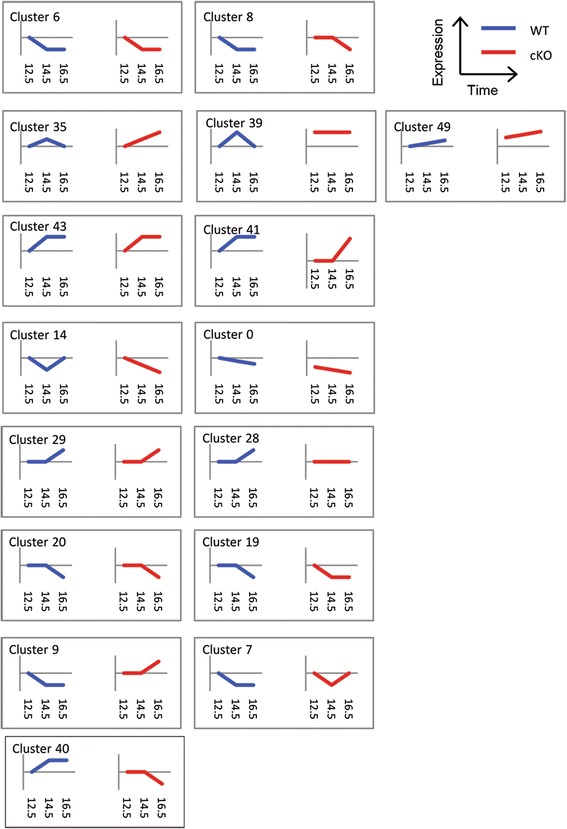
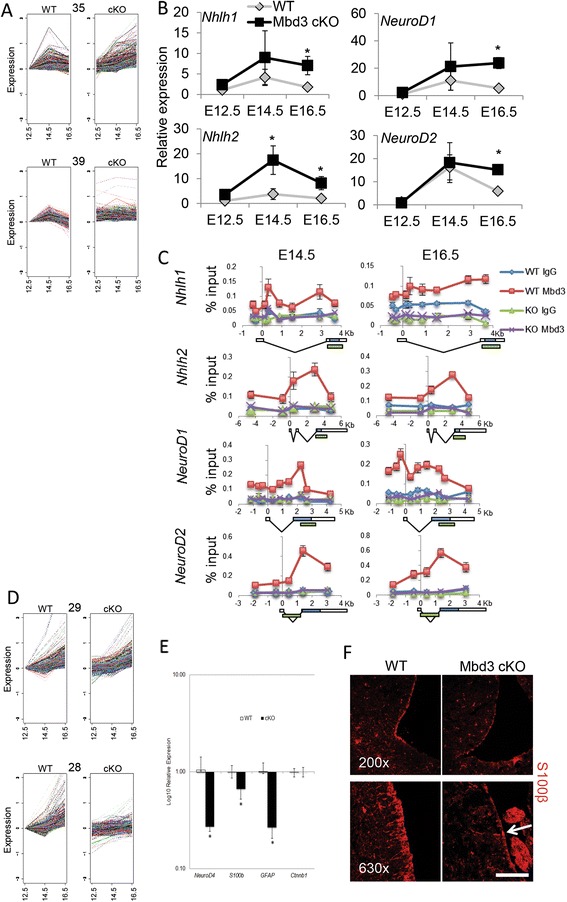
Results: Deletion of MBD3, a structural component of the NuRD complex, in the developing mouse central nervous system resulted in reduced cortical thickness, defects in the proper specification of cortical projection neuron subtypes and neonatal lethality. These phenotypes are due to alterations in PAX6+ apical progenitor cell outputs, as well as aberrant terminal neuronal differentiation programmes of cortical plate neurons. Normal numbers of PAX6+ apical neural progenitor cells were generated in the MBD3/NuRD-mutant cortex; however, the PAX6+ apical progenitor cells generate EOMES+ basal progenitor cells in reduced numbers. Cortical progenitor cells lacking MBD3/NuRD activity generate neurons that express both deep- and upper-layer markers. Using laser capture microdissection, gene expression profiling and chromatin immunoprecipitation, we provide evidence that MBD3/NuRD functions to control gene expression patterns during neural development.

Conclusions: Our data suggest that although MBD3/NuRD is not required for neural stem cell lineage commitment, it is required to repress inappropriate transcription in both progenitor cells and neurons to facilitate appropriate cell lineage choice and differentiation programmes.


Figures

Figure 1
Figure 1
Characterisation of Mbd3-mutant brains. (A) Representative MBD3 immunostaining (brown) on haematoxylin-stained coronal sections of E12.5, 14.5, 16.5 and 18.5 embryonic wild-type (WT) and mutant (Mbd3 cKO) brains. Black arrows denote the presumptive cortical plate, and white arrows denote the presumptive VZ. Wild-type and mutant sections were stained together on one slide, so the wild type acts as a positive control for staining in the mutant section. Scale bar = 100 μm. (B) Mean measurements of cortical thickness from three non-consecutive coronal sections per brain in wild-type (WT) and Mbd3 cKO) embryos. N = 3-6. *E14.5 P = 0.0192, df = 2; E16.5 P = 0.0001, df = 2; E18.5 P = 0.0001, df = 2. Error bars represent st. dev.
Figure 2
Figure 2
Mbd3-deficient embryonic brains show reduced production of EOMES+ basal neural progenitors and reduced neural output. (A) Representative immunostaining of E14.5, E16.5 and E18.5 coronal brain sections for PAX6. (B) Quantification of stained cells per 100 μm of cortical length. (C) Representative immunostaining of E14.5, E16.5 and E18.5 coronal brain sections for EOMES with DAPI counterstain. (D) Quantification of stained cells per 100 μm of cortical length. N = 3 to 6 *P = 0.0100, df = 2. (E) Representative immunostaining of E14.5 and E16.5 coronal brain sections for phosphorylated histone H3 (pH3). White arrows indicate the positions of apical and non-apical pH3+ cells. (F) Quantification of the number of apical surface pH3+ cells at E14.5 and E16.5 per 100 μm of cortical length, N = 3. (G) Quantification of the number of non-apical surface pH3+ cells at E14.5 (P = 0.067, df = 2) and at E16.5, N = 3, *P = 0.029, df = 2. Error bars represent st. dev. Scale bar = 100 μm.
Figure 3
Figure 3
Mbd3cKO mice produce fewer differentiated cells. (A) Pregnant mice were injected with a single pulse of BrdU 24 h prior to examination of the embryos at the indicated time points. Differentiated cell output was defined as the number of strongly BrdU (++)/PAX6− cells outside the VZ produced in that 24-h period. Representative immunostaining of E14.5 and E16.5 coronal brain sections for BrdU (red) and PAX6 (green). The white line represents the presumptive boundary between the VZ and outside the VZ (non-VZ). The bottom panels are a magnified image of the boxed area in the above picture. The green, red and yellow arrows point out a PAX6 only +, strong BrdU only + and PAX6/BrdU double-positive cell, respectively. (B) Quantification of the number of differentiated neurons produced in 24 h. Scale bar = 100 μm; N = 3 to 6, *P = 0.0134, df = 2. Error bars represent st. dev. Scale bar = 100 μm.
Figure 4
Figure 4
Fewer Mbd3-deficient PAX6+ apical progenitors divide between E15.5 and E16.5. (A) Representative immunostaining of E14.5 and E16.5 coronal brain sections for Ki67. The white lines indicate the presumptive boundary between the VZ and outside in the VZ (non-VZ). (B) Quantification of the number of Ki67+ cells in the VZ per 100 μm of cortical length. N = 3 to 6, *P = 0.0199, df = 2. (C) Representative immunostaining of E14.5 and E16.5 coronal brain sections for BrdU (red) and Ki67 (green). The bottom panel is a magnified image of the boxed area in the above picture. (D) Quantification of the percentage of BrdU+/Ki67− cells in the VZ negative for Ki67 per 100 μm of cortical length (right panel). N = 3 to 6, *P = 0.0015, df = 2. Error bars represent st. dev. Scale bar = 100 μm.
Figure 5
Figure 5
PAX6+ progenitors exiting the cell cycle result in decreased numbers of basal progenitors and neurons. This graphic illustrates how three representative PAX6+ apical progenitors in WT (left) and Mbd3cKO (right) mice make cell fate decisions over time. In the Mbd3cKO mice, a PAX6+ cell which exits the cell cycle without terminal differentiation into a neuron (far right) reduces the production of EOMES+ basal progenitors and neurons. This effect is small at first (E14.5) but increases in severity over time (E18.5). Note that in both WT and Mbd3cKO, the numbers of apical progenitors decreases over time, as expected, but at each time point, the numbers are comparable between the two groups.
Figure 6
Figure 6
Altered neuron production and cortical layering in Mbd3-deficient brains. Representative immunostaining of coronal brain sections at E14.5 (A), E16.5 (C) and E18.5 (E) for TBR1 (blue, layer 6), BCL11B (green, layer 5) and SATB2 (red, layers 2 to 4). Quantification of the number of stained cells per 100 μm cortical length at E14.5 (B), E16.5 (D, *P = 0.0040, df = 2 [TBR1]; P = 0.0220, df = 2 [BCL11b]; P = 0.0010, df = 2 [SATB2]) and E18.5 (F, *P = 0.0100, df = 2 [BCL11b]; P = 0.0090, df = 2 [BRN2]). Scale bar = 100 μm; N = 3 to 6. Error bars represent st. dev. White arrows in (B) and (C) point to the BCL11B high and low expressing cells in WT brains, while in cKO brains, only the BCL11B high-expressing cells are present. Red, green and blue bars in (C) and (E), WT merged images indicate distinct layers of cortical neurons present based on the staining. These layers do not appear or are reduced in the Mbd3 cKO brains (yellow bars, (C) and (E) merged images).
Figure 7
Figure 7
Failure of proper cortical neuron specification in the absence of MBD3. Pregnant mice were injected with BrdU once at E13.5 and the embryos examined at E18.5. (A) Representative immunostaining of E18.5 coronal brain sections for BrdU (red) and upper-layer neuronal marker BRN2 (white). (B) Representative immunostaining of E18.5 coronal brain sections for BrdU (red), TBR1 (green) and SATB2 (white). (C) Quantification of the percentage of cortical plate BrdU+ cells which are also positive for TBR1 (*P = 0.0210, df = 2) or positive for both TBR1 and SATB2 (*P = 0.0016, df = 2) per 100 μm of cortical length. The white lines indicate the presumptive lower boundary of the cortical plate. Scale bar = 100 μm; N = 3 to 6. Error bars represent st. dev.
Figure 8
Figure 8
Total output from the STEM programme. Significant clusters identified by STEM analysis. For each panel, the expression in wild-type embryos is shown in blue on the left and in mutant embryos in red on the right. Developmental time (E12.5, E14.5 and E16.5) is plotted on the x-axis and expression levels on the y-axis in arbitrary units. For each cluster, the data are plotted along the x-axis as WT12.5, WT14.5 and WT16.5 (blue) and cKO12.5, cKO14.5 and cKO16.5 (red).
Figure 9
Figure 9
MBD3/NuRD modulates gene expression patterns during mammalian neurogenesis. (A) Expression of genes found in clusters 35 and 39 are plotted individually for wild-type (left) and Mbd3 cKO (right) samples. (B) Relative expression of indicated genes in WT and mutant progenitors at E12.5, E14.5 and E16.5. In all cases, expression values are plotted relative to WT expression at E12.5. N = 3 to 4. For wild-type vs. mutant samples at E14.5 for Nhlh2 *P = 0.0066, df = 2. For wild-type vs. mutant samples at E16.5 *P = 0.0032, df = 2 (Nhlh1); P = 0.0002, df = 2 (NeuroD1); P = 0.0403, df = 2 (Nhlh2); P = 0.0001, df = 2 (NeuroD2). (C) Chromatin immunoprecipitation (ChIP) was performed using an anti-Mbd3 antibody or rabbit IgG control in wild-type (WT) and conditional knockout (KO) cortices at E14.5 and E16.5. Immunoprecipitates were probed with primer pairs (listed in Table 3) located across the indicated genes and plotted as percentage of input (y-axis; error bars represent st. dev.). Numbers across the x-axis indicate distance relative to the transcription start site for indicated genes. Gene structure is shown below the graphs: white boxes represent non-coding regions, blue boxes represent coding regions, and green boxes indicate the presence of putative enhancer regions based upon histone ChIP data available on mm9 from the UCSC genome browser. (D) Expression of genes found in clusters 28 and 29 are plotted individually for wild-type (left) and cKO (right) samples. (E) Relative expression of indicated genes in wild-type and mutant brain samples from E16.5. N = 3; *P = 0.0004 (NeuroD4), P = 0.0026 (S100β), P = 0.0001 (Gfap), df = 2; error bars represent st. dev. (F) Representative immunostaining of E18.5 coronal brain sections for S100β (red). White arrow indicates a rare, positively stained cell in the Mbd3 cKO sample Scale bar = 100 μm at 200× magnification and 50 μm at 630× magnification.

Similar articles

Cited by

References

    1. Rakic P. The radial edifice of cortical architecture: from neuronal silhouettes to genetic engineering. Brain Res Rev. 2007;55:204–19. doi: 10.1016/j.brainresrev.2007.02.010. - DOI - PMC - PubMed
    1. Hirabayashi Y, Gotoh Y. Epigenetic control of neural precursor cell fate during development. Nat Rev Neurosci. 2010;11:377–88. doi: 10.1038/nrn2810. - DOI - PubMed
    1. Pontious A, Kowalczyk T, Englund C, Hevner RF. Role of intermediate progenitor cells in cerebral cortex development. Dev Neurosci. 2008;30:24–32. doi: 10.1159/000109848. - DOI - PubMed
    1. Ahringer J. NuRD and SIN3 histone deacetylase complexes in development. Trends Genet. 2000;16:351–6. doi: 10.1016/S0168-9525(00)02066-7. - DOI - PubMed
    1. McDonel P, Costello I, Hendrich B. Keeping things quiet: roles of NuRD and Sin3 co-repressor complexes during mammalian development. Int J Biochem Cell B. 2009;41:108–16. doi: 10.1016/j.biocel.2008.07.022. - DOI - PMC - PubMed

Publication types

MeSH terms