. 2015 May 2:16:12.
doi: 10.1186/s40360-015-0012-2.

Effects of cytarabine on activation of human T cells - cytarabine has concentration-dependent effects that are modulated both by valproic acid and all-trans retinoic acid

Affiliations

Effects of cytarabine on activation of human T cells - cytarabine has concentration-dependent effects that are modulated both by valproic acid and all-trans retinoic acid

Elisabeth Ersvaer et al. BMC Pharmacol Toxicol. .

Abstract

Background: Cytarabine is used in the treatment of acute myeloid leukemia (AML). Low-dose cytarabine can be combined with valproic acid and all-trans retinoic acid (ATRA) as AML-stabilizing treatment. We have investigated the possible risk of immunotoxicity by this combination. We examined the effects of cytarabine combined with valproic acid and ATRA on in vitro activated human T cells, and we tested cytarabine at concentrations reached during in vivo treatment with high doses, conventional doses and low doses.

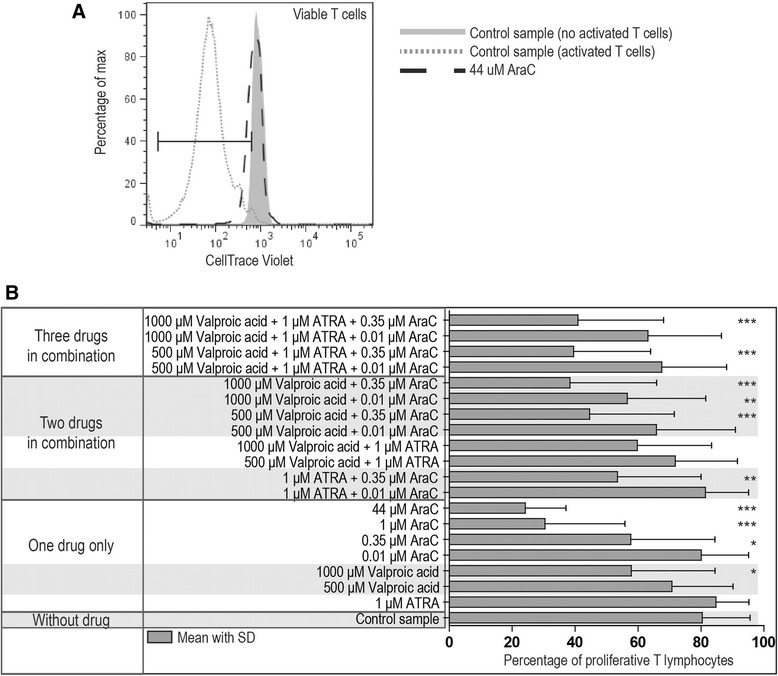
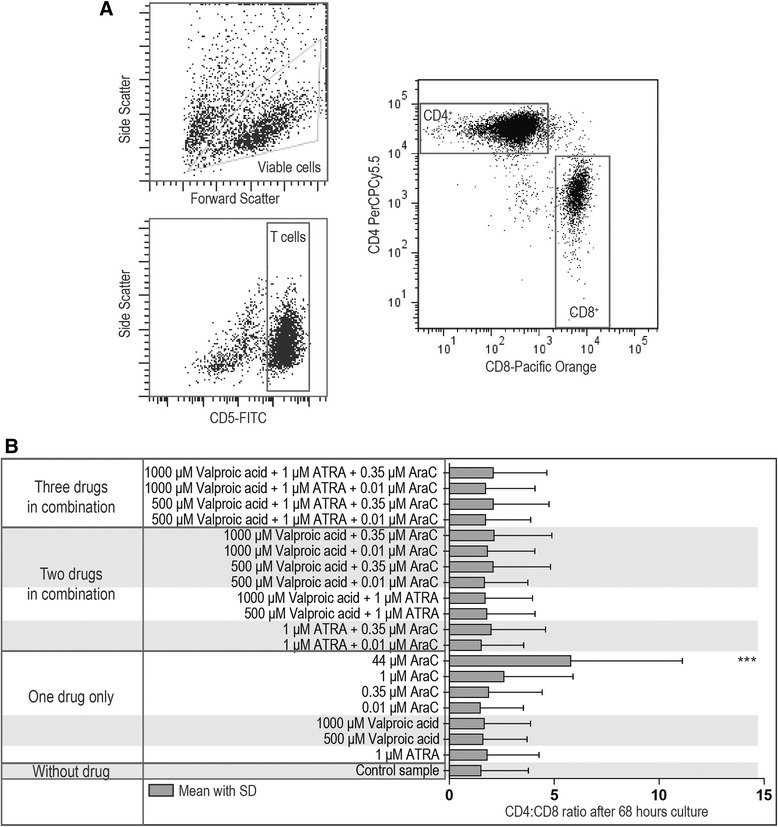
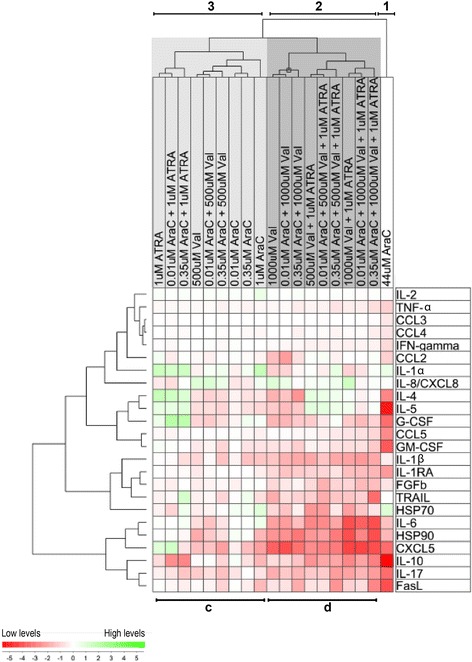
Methods: T cells derived from blood donors were activated in vitro in cell culture medium alone or supplemented with ATRA (1 μM), valproic acid (500 or 1000 μM) or cytarabine (0.01-44 μM). Cell characteristics were assessed by flow cytometry. Supernatants were analyzed for cytokines by ELISA or Luminex. Effects on primary human AML cell viability and proliferation of low-dose cytarabine (0.01-0.5 μM) were also assessed. Statistical tests include ANOVA and Cluster analyses.

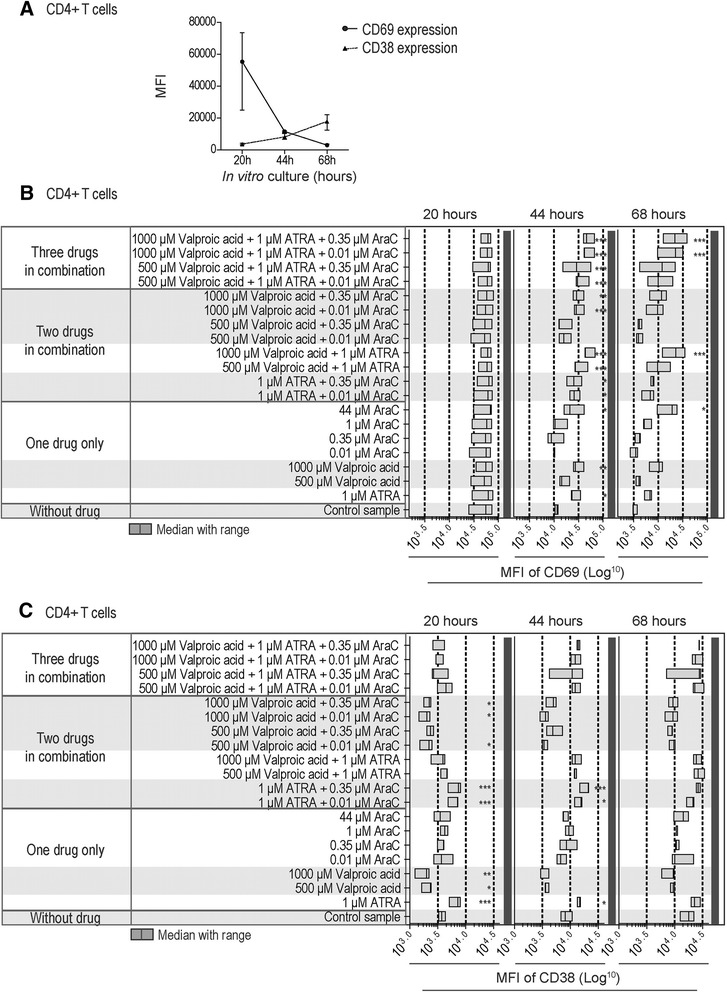
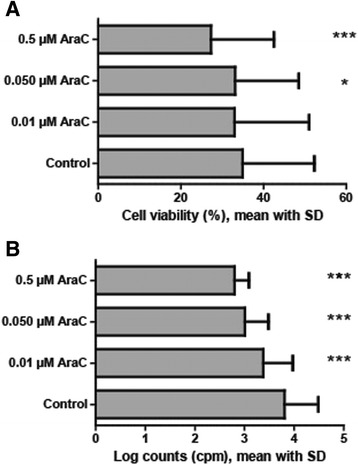
Results: Only cytarabine 44 μM had both antiproliferative and proapoptotic effects. Additionally, this concentration increased the CD4:CD8 T cell ratio, prolonged the expression of the CD69 activation marker, inhibited CD95L and heat shock protein (HSP) 90 release, and decreased the release of several cytokines. In contrast, the lowest concentrations (0.35 and 0.01 μM) did not have or showed minor antiproliferative or cytotoxic effects, did not alter activation marker expression (CD38, CD69) or the release of CD95L and HSP90, but inhibited the release of certain T cell cytokines. Even when these lower cytarabine concentrations were combined with ATRA and/or valproic acid there was still no or minor effects on T cell viability. However, these combinations had strong antiproliferative effects, the expression of both CD38 and CD69 was altered and there was a stronger inhibition of the release of FasL, HSP90 as well as several cytokines. Cytarabine (0.01-0.05 μM) showed a dose-dependent antiproliferative effect on AML cells, and in contrast to the T cells this effect reached statistical significance even at 0.01 μM.

Conclusions: Even low levels of cytarabine, and especially when combined with ATRA and valproic acid, can decrease T cell viability, alter activation-induced membrane-molecule expression and decrease the cytokine release.


Figures

Figure 1
Figure 1
Viability of activated T lymphocytes after exposure to cytarabine, ATRA and valproic acid alone or in combinations. PBMCs derived from healthy blood donors (n = 7) were cultured in vitro with T cell activating anti-CD3 and anti-CD28, and the viability was analyzed by flow cytometry after 4 days of culture in medium alone or with the indicated drugs. (A) The gating strategy to analyze the viability of CD5+ T lymphocytes is shown for a control sample and the corresponding sample of cells exposed to cytarabine 44 μM. T cells were defined as (i) viable when negative staining with the LIVE/DEAD Far Red Fixable Dead Cell Stain, (ii) apoptotic when being LIVE/DEAD Far Red Fixable Dead Cell Stain negative and Annexin V positive, and (iii) dead when being LIVE/DEAD Far Red Fixable Dead Cell Stain positive. (B) The overall results are summarized as stacked bar graphs for the control samples and samples exposed to the indicated drugs or drug combinations. The results are presented as the mean percentages for viable, dead and apoptotic CD5+ T cells. A repeated measure ANOVA with Dunnett’s Multiple Comparison Test was used to determine statistically significant differences (*p <0.05; **p <0.01; ***p <0.001).
Figure 2
Figure 2
Proliferation of activated T lymphocytes after exposure to cytarabine, ATRA and valproic acid alone or in combinations. PBMCs derived from healthy blood donors (n = 7) were stained with the cell proliferation dye CellTrace™ Violet and subsequently activated by in vitro culture in the presence of anti-CD3 and anti-CD28. Flow cytometric analysis of proliferation was done after 4 days of culture in medium without drugs (control) or in the presence of drugs/drug combinations. (A) The gating strategy to measure the proliferative response of CD5+ T lymphocytes is shown for three representative samples (two control samples –unstimulated and stimulated– and one sample with cytarabine 44 μM). Cultures without anti-CD3 and anti-CD28 and thereby no proliferating cells were used as the negative gating control. (B) The overall results are presented as bar graphs for the control samples and samples exposed to the indicated single drugs or drug combinations. Results are presented as the mean percentages (with SD) of proliferative T cells. A repeated measure ANOVA with Dunnett’s Multiple Comparison Test was used to determine statistically significant differences (*p <0.05; **p <0.01; ***p <0.001).
Figure 3
Figure 3
The CD4:CD8 ratio of activated T lymphocytes after exposure to cytarabine, ATRA and valproic acid alone or in combination. PBMCs derived from three healthy blood donors were activated by anti-CD3 plus anti-CD28 during 3 days of in vitro culture before flow cytometric analysis of the CD4:CD8 ratio. Cultures were prepared without drugs, with single drugs or with drug combinations. (A) The figure shows the gating strategy for estimation of CD4+CD5+ and CD8+CD5+ T cells lymphocytes in a representative experiment. (B) The overall results are presented as bar graph (mean ratio with SD) for the drugfree control cultures and cultures prepared with the indicated single drugs or drug combinations. A repeated measure ANOVA with Dunnett’s Multiple Comparison Test was used to determine statistically significant differences (*p <0.05; **p <0.01; ***p <0.001).
Figure 4
Figure 4
Expression of the CD69 and CD38 activation markers by anti-CD3 plus anti-CD28 activated CD8+ T lymphocytes – effects of cytarabine, ATRA and valproic acid tested alone or in combination. PBMCs derived from three healthy donors were activated during in vitro culture with anti-CD3 and anti-CD28, and flow-cytometric analysis of surface CD69 and CD38 expression was performed after 20, 44, and 68 hours of culture. (A) The figure shows the mean fluorescence intensity (MFI) of surface CD69 and CD38 expression by CD8+CD5+ T lymphocytes in drugfree control cultures after 20, 44, and 68 hours (median and range, three experiments). (B) The overall results for CD69 expression are presented as bar graph (median MFI and range) for CD8+CD5+ T lymphocytes cultured in vitro for 20, 44, and 68 hours in the presence of the indicated single drugs or drug combinations. (C) The overall results for CD38 expression are presented as bar graph (median MFI and range) for CD8+CD5+ T lymphocytes cultured in vitro for 20, 44, and 68 hours in the presence of the indicated single drugs or drug combinations. Repeated measures ANOVA with Dunnett’s Multiple Comparison Test was for the statistical analyses (*p <0.05; **p <0.01; ***p <0.001).
Figure 5
Figure 5
Expression of the CD69 and CD38 activation markers by anti-CD3 plus anti-CD28 activated CD4+ T lymphocytes – effects of cytarabine, ATRA and valproic acid tested alone or in combination. PBMCs derived from three healthy donors were activated during in vitro culture with anti-CD3 and anti-CD28, and flow-cytometric analysis of surface CD69 and CD38 expression was performed after 20, 44, and 68 hours of culture. (A) The figure shows the mean fluorescence intensity (MFI) of surface CD69 and CD38 expression by CD4+CD5+ T lymphocytes in drug-free control cultures after 20, 44, and 68 hours (median and range, three experiments). (B) The overall results for CD69 expression are presented as bar graph (median MFI and range) for CD4+CD5+ T lymphocytes cultured in vitro for 20, 44, and 68 hours in the presence of the indicated single drugs or drug combinations. (C) The overall results for CD38 expression are presented as bar graph (median MFI and range) for CD4+CD5+ T lymphocytes cultured in vitro for 20, 44, and 68 hours in the presence of the indicated single drugs or drug combinations. Repeated measures ANOVA with Dunnett’s Multiple Comparison Test was for the statistical analyses (*p <0.05; **p <0.01; ***p <0.001).
Figure 6
Figure 6
The release of FasL, TRAIL, HSP70 and HSP90 by anti-CD3 plus anti-CD28 activated normal T cells – effects of cytarabine, ATRA and valproic acid tested alone or in combination. The supernatant concentrations of FasL, TRAIL, HSP90 and HSP70 were determined after 4 days of PBMC culture with anti-CD3 plus anti-CD28. Cultures were prepared in medium alone or together with the single drugs or drug combinations indicated in the figures. (A) The upper figure presents the FasL (left panel) and TRAIL (right panel) levels, the lower figure (B) presents the levels of HSP90 (left panel) and HSP70 (right panel). All results are presented as the mean with SD. Repeated measures ANOVA with Dunnett’s Multiple Comparison Test against control samples were used for statistical analyses (*p <0.05; **p <0.01; ***p <0.001).
Figure 7
Figure 7
The soluble release profile by activated T cells is altered by valproic acid, ATRA and cytarabine – a two-ways hierarchical cluster analysis. PBMCs derived from 7 healthy individuals were cultured with the T cell activating signal anti-CD3 plus anti-CD28 for 4 days before supernatants were harvested and cytokine levels determined. The cells were then cultured in drugfree control cultures and together with ATRA 1 μM, valproic acid 500 and 100 μM, and cytarabine 0.01, 0.35, 1 and 44 μM, and each drug was also tested in dual or triple combinations as indicated at the top of the figure. The overall results are presented in detail in Additional file 1: Table S1-S4. The results from a two-ways hierarchical cluster analysis including FasL, TRAIL, HSP70 and HSP90 together with 20 cytokines are presented in the figure. We investigated the levels of (i) the immunoregulatory cytokines IFNγ and TNFα; (ii) the growth factors G-CSF, GM,-CSF, VEGF and bFGF; (iii) the chemokines CCL2-5 and CXCL5; and (iv) the interleukins IL1α, IL1β, IL1RA, IL2, IL4-6, IL8, IL10 and IL17. The cytokines formed 4 main clusters as indicated on the left margin of the figure. The analysis included the 19 single drug/drug combinations used throughout the study and the various drugs/drug combinations formed three main clusters.
Figure 8
Figure 8
Effects of low-dose cytarabine on the viability and proliferation of primary human AML cells. (A) The viability of primary human AML cells after 40 hours of in vitro culture in medium alone. Cytarabine seems to have a dose-dependent toxic effect, but the difference reached statistical significance only for the two highest drug concentrations (0.5 and 0.05 μM). (B) Low-dose cytarabine showed a dose-dependent antiproliferative effect for the leukemic cells when testing cytokine-dependent AML cell proliferation (medium supplemented with 20 ng/mL of GM-CSF, SCF and Flt3l). The growth inhibition reached statistical significance even when testing cytarabine 0.01 μM. All results are presented as the mean with SD, the pair sample t-test was used for the statistical analyses of the apoptosis data, and the Wilcoxon signed rank test for the proliferation data (*p <0.05; **p <0.01; ***p <0.001).

References

    1. Liseth K, Sjo M, Paulsen K, Bruserud O, Ersvaer E. Early pre-engraftment, functional, in vitro responsiveness of T lymphocytes in allotransplanted, acute leukemia patients: proliferation and release of a broad profile of cytokines, possibly predictive of graft-versus-host disease. Eur Cytokine Netw. 2010;21(1):40–49. - PubMed
    1. Mackall C, Fry T, Gress R, Peggs K, Storek J, Toubert A, et al. Background to hematopoietic cell transplantation, including post transplant immune recovery. Bone Marrow Transplant. 2009;44(8):457–462. doi: 10.1038/bmt.2009.255. - DOI - PubMed
    1. Behl D, Porrata LF, Markovic SN, Letendre L, Pruthi RK, Hook CC, et al. Absolute lymphocyte count recovery after induction chemotherapy predicts superior survival in acute myelogenous leukemia. Leukemia. 2006;20(1):29–34. doi: 10.1038/sj.leu.2404032. - DOI - PubMed
    1. Porrata LF, Litzow MR, Tefferi A, Letendre L, Kumar S, Geyer SM, et al. Early lymphocyte recovery is a predictive factor for prolonged survival after autologous hematopoietic stem cell transplantation for acute myelogenous leukemia. Leukemia. 2002;16(7):1311–1318. doi: 10.1038/sj.leu.2402503. - DOI - PubMed
    1. Parkman R, Cohen G, Carter SL, Weinberg KI, Masinsin B, Guinan E, et al. Successful immune reconstitution decreases leukemic relapse and improves survival in recipients of unrelated cord blood transplantation. Biol Blood Marrow Transplant. 2006;12(9):919–927. doi: 10.1016/j.bbmt.2006.05.008. - DOI - PubMed

Publication types

MeSH terms