. 2015 May 2:11:24.
doi: 10.1186/s12990-015-0023-4.

Polysulfide evokes acute pain through the activation of nociceptive TRPA1 in mouse sensory neurons

Affiliations

Polysulfide evokes acute pain through the activation of nociceptive TRPA1 in mouse sensory neurons

Yukari Hatakeyama et al. Mol Pain. .

Abstract

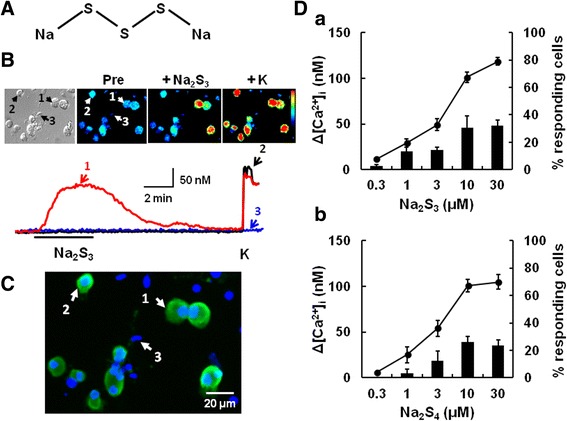
Background: Hydrogen sulfide (H2S) is oxidized to polysulfide. Recent reports show that this sulfur compound modulates various biological functions. We have reported that H2S is involved in inflammatory pain in mice. On the other hand, little is known about the functional role of polysulfide in sensory neurons. Here we show that polysulfide selectively stimulates nociceptive TRPA1 and evokes acute pain, using TRPA1-gene deficient mice (TRPA1(-/-)), a heterologous expression system and a TRPA1-expressing cell line.

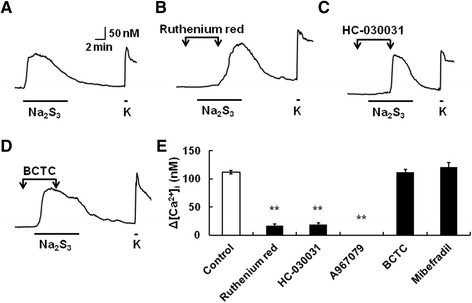
Results: In wild-type mouse sensory neurons, polysulfide elevated the intracellular Ca concentration ([Ca(2+)]i) in a dose-dependent manner. The half maximal effective concentration (EC50) of polysulfide was less than one-tenth that of H2S. The [Ca(2+)]i responses to polysulfide were observed in neurons responsive to TRPA1 agonist and were inhibited by blockers of TRPA1 but not of TRPV1. Polysulfide failed to evoke [Ca(2+)]i increases in neurons from TRPA1(-/-) mice. In RIN-14B cells, constitutively expressing rat TRPA1, polysulfide evoked [Ca(2+)]i increases with the same EC50 value as in sensory neurons. Heterologously expressed mouse TRPA1 was activated by polysulfide and that was suppressed by dithiothreitol. Analyses of the TRPA1 mutant channel revealed that cysteine residues located in the internal domain were related to the sensitivity to polysulfide. Intraplantar injection of polysulfide into the mouse hind paw induced acute pain and edema which were significantly less than in TRPA1(-/-) mice.

Conclusions: The present data suggest that polysulfide functions as pronociceptive substance through the activation of TRPA1 in sensory neurons. Since the potency of polysulfide is higher than parental H2S and this sulfur compound is generated under pathophysiological conditions, it is suggested that polysulfide acts as endogenous ligand for TRPA1. Therefore, TRPA1 may be a promising therapeutic target for endogenous sulfur compound-related algesic action.


Figures

Figure 1
Figure 1
Polysulfide stimulates a subset of mouse sensory neurons. (A) The structural formula of Na2S3. (B) An image under transmitted light, and pseudocolor images; before (Pre), after the application of Na2S3 (+Na2S3, 10 μM) and KCl (+K, 80 mM). (C) A merged image of immunostaining with antibody against PGP9.5, a neural marker and of nuclear staining with Hoechst 33752. After [Ca2+]i responses were measured, cells were subjected to immunostaining.. In (B), cells with arrows (1–3) correspond to cells in the actual recordings and immunocytochemical image. Note that only K-responding cells show positive immunoreactivity to PGP9.5 (D) Circles and columns show the concentration-response curve for polysulfide-induced [Ca2+]i increases and the percentage of polysulfide-responding neurons among all neurons, respectively (a:Na2S3, b:Na2S4). The percentages of polysulfide-responding cells were calculated from the percentage obtained with each coverslip. Symbols with vertical lines show mean ± SEM (Na2S3; n = 42–74, Na2S4; n = 33–44, from 3 mice).
Figure 2
Figure 2
Polysulfide-responsive neurons highly correspond to TRPA1 agonist-sensitive ones. (A) Actual recordings of [Ca2+]i responses to sequential application of Na2S3 (10 μM), allylisothiocyanate (AITC, 0.3 mM), capsaicin (Cap, 1 μM), and KCl (K, 80 mM). (B) An image under transmitted light, and pseudocolor images; before (Pre) and after the application of Na2S3 (+Na2S3), allylisothiocyanate (+AITC), capsaicin (+Cap), and KCl (+K). In a bright field image, cells with arrows (1–3) correspond to (A). (C) Venn diagram showing the sensitivities to Na2S3, AITC, capsaicin, and KCl (n = 322 from five mice). Numbers indicate the number of cells responding to each stimulus. A number in the outermost frame expresses the number of neurons responding to KCl alone. Note that Na2S3-responding neurons are mostly coincident with AITC-responding ones.
Figure 3
Figure 3
Inhibition of polysulfide-induced [Ca2+]i increases by TRPA1 blockers. (A) Actual recording of [Ca2+]i responses to Na2S3 (10 μM, 8 min) and KCl (K, 80 mM) in mouse DRG neurons. (B-D) The effects of ruthenium red (1 μM), HC-030031 (10 μM) and BCTC (10 μM) on the Na2S3-induced [Ca2+]i increases. Each blocker was applied 2 min before and for 4 min during application of Na2S3. (E) Summarized effects of these blocking agents. Open and filled columns show the increases of [Ca2+]i responses to Na2S3 in the absence (Control) and presence of these blocking agents, respectively. Columns with vertical lines show mean ± SEM (control; n = 201, ruthenium red; n = 32, HC-030031; n = 24, A967079 (1 μM); n = 43, BCTC; n = 43, mibefradil (10 μM); n = 44, from 3–6 mice). **P, < 0.01 vs. Control.
Figure 4
Figure 4
[Ca2+]i responses to polysulfide in TRPV1(−/−) and TRPA1(−/−) mouse DRG neurons. Actual recordings of [Ca2+]i responses to sequential application of Na2S3 (10 μM), allylisothiocyanate (AITC, 0.3 mM), capsaicin (Cap, 1 μM), and KCl (K, 80 mM) in TRPV1(−/−) (A) and TRPA1(−/−) (B) mouse DRG neurons. (C) Columns showing the % responding cells among all neurons in each animal. Columns with vertical lines show mean ± SEM (wild type; n = 322, TRPV1(−/−); n = 278, TRPA1(−/−); n = 253, from 3–5 mice for each genotype). **P, < 0.01.
Figure 5
Figure 5
Desensitization of TRPA1 by polysulfide in mouse DRG neurons. (A) (a) Actual recording of [Ca2+]i responses to Na2S3 (10 μM) twice with an interval of 15 min and then allylisothiocyanate (AITC, 0.3 mM), and KCl (K, 80 mM), and (b) those to AITC (0.3 mM) twice with an interval of 15 min and then Na2S3 (10 μM), and KCl (80 mM). (B) Open and filled columns show the increases of [Ca2+]i responses to Na2S3 (a) and AITC (b) in the first stimulation (Naïve), and those in the second stimulation after each chemical, respectively. Columns with vertical lines show mean ± SEM (Ba; n = 25, Bb; n = 54). **P, < 0.01 vs. Naive.
Figure 6
Figure 6
[Ca2+]i and current responses to polysulfide in HEK 293 cells expressing mouse TRPA1. (A) Left shows actual traces of [Ca2+]i responses to Na2S3 (10 μM) and allylisothiocyanate (AITC, 0.3 mM) in HEK 293 cells expressing mouse TRPA1 (mTRPA1-HEK) and those to Na2S3 and capsaicin (Cap, 1 μM) in HEK 293 cells expressing mouse TRPV1 (mTRPV1-HEK). Right graph shows that the concentration-response relationships for Na2S3 in mTRPA1-HEK (closed circles) and mTRPV1-HEK (open circles). Symbols with vertical lines show mean ± SEM (mTRPA1-HEK; n = 28-65 cells, mTRPV1-HEK; n = 52-53 cells, from three different transfections). (B) Representative traces of whole-cell currents activated by Na2S3 (10 μM) followed by AITC (0.3 mM) in HEK293 cells expressing mouse TRPA1. The current–voltage (I-V) curves for Na2S3 (1) and AITC (2) exhibit outward rectification. (C,a) An actual trace of [Ca2+]i response to Na2S3 (10 μM) and AITC (0.3 mM) in RIN-14B cells (upper panel). The Na2S3-induced [Ca2+]i increase is suppressed by HC030031 (10 μM, lower panel). (C,b) The concentration-response relationship for Na2S3 in RIN-14B cells (n = 95-150, from three experiments). Vertical lines for SEM are embedded in each symbol.
Figure 7
Figure 7
Involvement of the N-terminal cysteine residues of mouse TRPA1 in its activation by polysulfide. (A) The Na2S3 (10 μM)-induced [Ca2+]i increase was inhibited by dithiothreitol (DTT) (a) 2 min before and during 4 min application of Na2S3, (b) after 4 min in HEK 293 cells expressing mouse TRPA1 (mTRPA1-HEK). The upper panels show [Ca2+]i responses to Na2S3 without DTT, and the lower ones those in the presence of DTT. (B) Summarized effects of DTT. (a) Open and filled columns show the increases of [Ca2+]i responses to Na2S3 in the absence (Control) and presence of DTT, respectively. (b) Times required for half-decline of [Ca2+]i responses to Na2S3 (T1/2) in the absence (Control) and presence of DTT. T1/2 was calculated by subtracting the value of the time when the Na2S3-induced [Ca2+]i increase was reduced by half from that when Na2S3-induced [Ca2+]i increase peaked. Columns with vertical lines show mean ± SEM (a; n = 23–32, b; n = 55–63, from three different transfections). **P < 0.01. (C) The [Ca2+]i increments induced by Na2S3 (10 μM and 30 μM) and 2APB (100 μM and 300 μM) in mTRPA1-HEK (left columns) and HEK293 cells expressing mouse TRPA1 mutant (mTRPA1-2C, right columns). Columns with vertical lines show mean ± SEM (wild-type mTRPA1; n = 55–72, mTRPA1-2C; n = 46–63, from three separate transfections). **P, < 0.01 vs. ∆[Ca2+]i in mTRPA1-HEK.
Figure 8
Figure 8
Intraplantar administration of polysulfide produces pain-related behavior in mice. (A) Changes in number of pain-related behaviors (a; Licking, b; Lifting) of wild-type and TRPA1(−/−) mice after intraplantarly injection of Na2S3 (500 nmol/paw) and summarized number of behaviors during 10 min after Na2S3 injection. (B) Left and right panel show that changes in paw thickness of wild-type and TRPA1(−/−) mice before and after intraplantarly injection of Na2S3 (left), and changes in paw thickness 30 min after injection of Na2S3 or HEPES-buffered solution (Vehicle), respectively. Symbols and columns with vertical lines show mean ± SEM (A: Wild-type; n = 5, TRPA1(−/−); n = 4, TRPV1(−/−); n = 4, B: Wild-type; n = 4, TRPA1(−/−); n = 4, TRPV1(−/−); n = 4). *P, < 0.05, **P, <0.01, vs. Wild type.

References

    1. Kimura H. Hydrogen sulfide: its production, release and functions. Amino Acids. 2011;41:113–21. doi: 10.1007/s00726-010-0510-x. - DOI - PubMed
    1. Mustafa AK, Gadalla MM, Sen N, Kim S, Mu W, Gazi SK, et al. H2S signals through protein S-sulfhydration. Sci Signal. 2009;2:ra72. - PMC - PubMed
    1. Vandiver MS, Paul BD, Xu R, Karuppagounder S, Rao F, Snowman AM, et al. Sulfhydration mediates neuroprotective actions of parkin. Nat Commun. 2013;4:1626. doi: 10.1038/ncomms2623. - DOI - PMC - PubMed
    1. Trevisani M, Patacchini R, Nicoletti P, Gatti R, Gazzieri D, Lissi N, et al. Hydrogen sulfide causes vanilloid receptor 1-mediated neurogenic inflammation in the airways. Br J Pharmacol. 2005;145:1123–31. doi: 10.1038/sj.bjp.0706277. - DOI - PMC - PubMed
    1. Bhatia M, Zhi L, Zhang H, Ng SW, Moore PK. Role of substance P in hydrogen sulfide-induced pulmonary inflammation in mice. Am J Physiol Lung Cell Mol Physiol. 2006;291:L896–904. doi: 10.1152/ajplung.00053.2006. - DOI - PubMed

Publication types

MeSH terms

LinkOut - more resources