. 2015 May 2:13:31.
doi: 10.1186/s12915-015-0141-5.

A chromatin code for alternative splicing involving a putative association between CTCF and HP1α proteins

Affiliations

A chromatin code for alternative splicing involving a putative association between CTCF and HP1α proteins

Eneritz Agirre et al. BMC Biol. .

Abstract

Background: Alternative splicing is primarily controlled by the activity of splicing factors and by the elongation of the RNA polymerase II (RNAPII). Recent experiments have suggested a new complex network of splicing regulation involving chromatin, transcription and multiple protein factors. In particular, the CCCTC-binding factor (CTCF), the Argonaute protein AGO1, and members of the heterochromatin protein 1 (HP1) family have been implicated in the regulation of splicing associated with chromatin and the elongation of RNAPII. These results raise the question of whether these proteins may associate at the chromatin level to modulate alternative splicing.

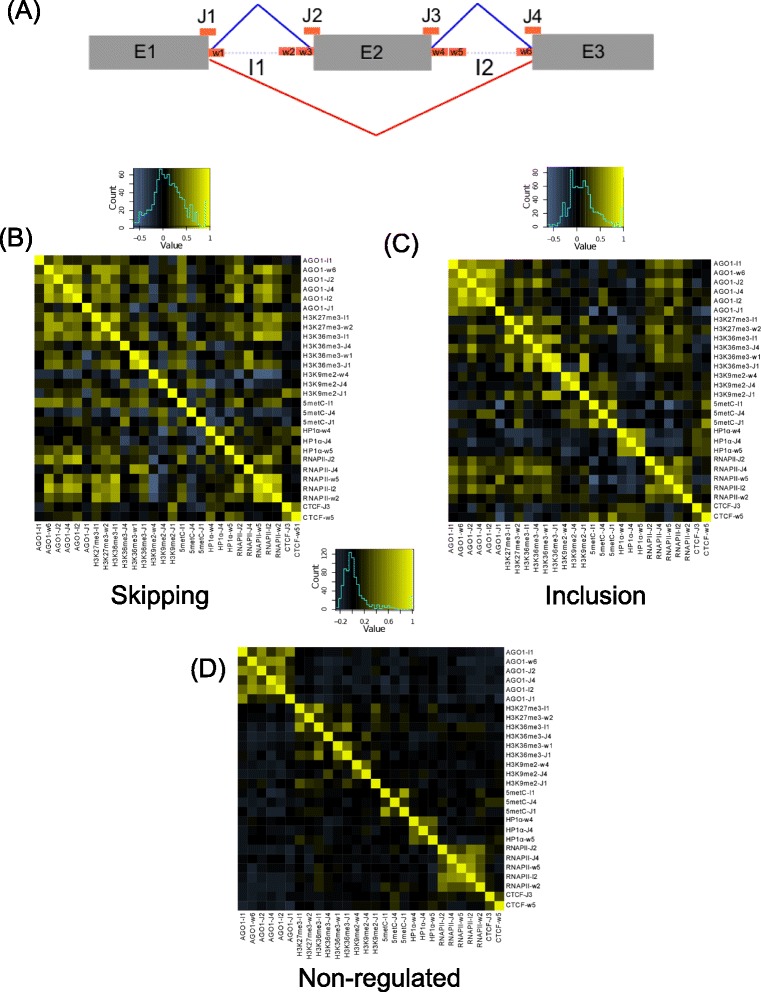
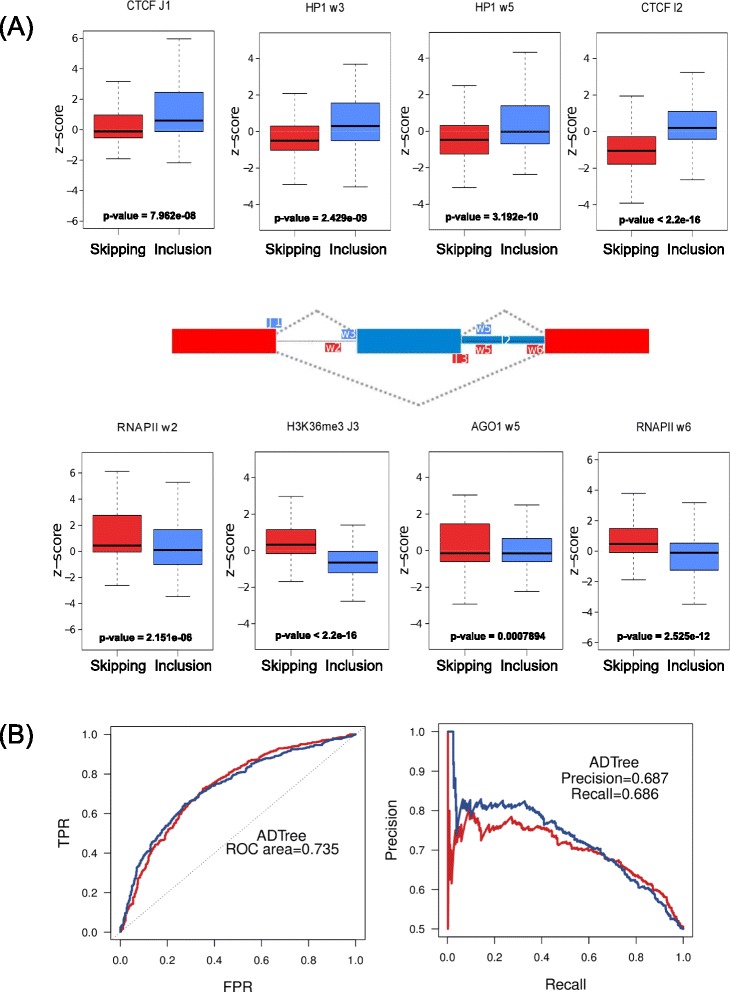
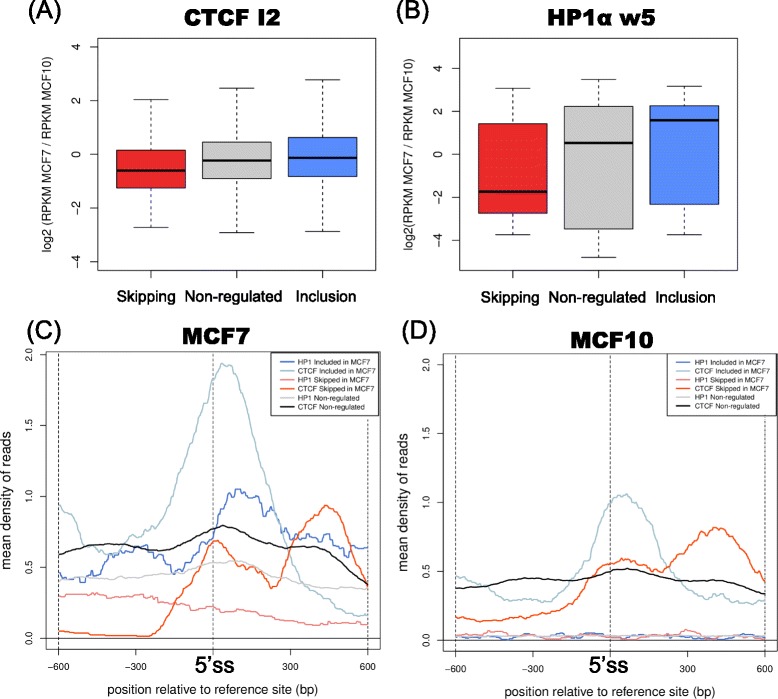
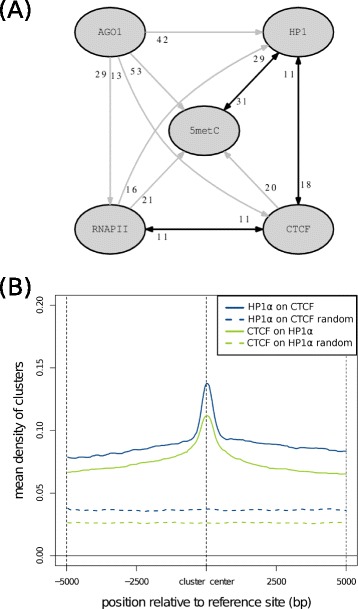
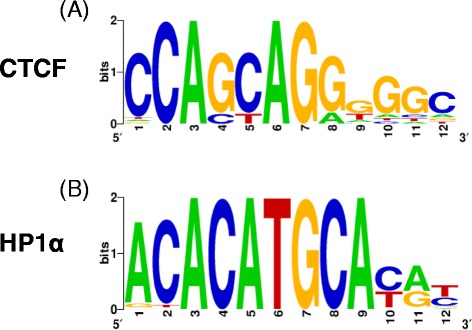
Results: Using chromatin immunoprecipitation sequencing (ChIP-Seq) data for CTCF, AGO1, HP1α, H3K27me3, H3K9me2, H3K36me3, RNAPII, total H3 and 5metC and alternative splicing arrays from two cell lines, we have analyzed the combinatorial code of their binding to chromatin in relation to the alternative splicing patterns between two cell lines, MCF7 and MCF10. Using Machine Learning techniques, we identified the changes in chromatin signals that are most significantly associated with splicing regulation between these two cell lines. Moreover, we have built a map of the chromatin signals on the pre-mRNA, that is, a chromatin-based RNA-map, which can explain 606 (68.55%) of the regulated events between MCF7 and MCF10. This chromatin code involves the presence of HP1α, CTCF, AGO1, RNAPII and histone marks around regulated exons and can differentiate patterns of skipping and inclusion. Additionally, we found a significant association of HP1α and CTCF activities around the regulated exons and a putative DNA binding site for HP1α.

Conclusions: Our results show that a considerable number of alternative splicing events could have a chromatin-dependent regulation involving the association of HP1α and CTCF near regulated exons. Additionally, we find further evidence for the involvement of HP1α and AGO1 in chromatin-related splicing regulation.


Figures

Figure 1
Figure 1
Attributes and their correlations. (A) Diagram of the 15 windows defined on exon cassette events: 300 nt length windows flanking exons (w1,…, w6), 200 nt length regions covering 100 nt on either side of the exon boundaries (J1,…,J4), the entire exons (E1, E2 and E3) and the extent of the flanking introns (I1 and I2). Pearson correlation coefficients were calculated pairwise for the different attributes in skipping (B), inclusion (C) and non-regulated (D) events. The three heatmaps show in the same order those attribute pairs that have R ≥0.6 or R ≤−0.5 in inclusion and/or skipping events, and involving attributes from two different experiments. Correlation coefficient values are given in Additional file 1: Tables S1–S5. The heatmaps for the pairwise correlations for all the 120 attributes for inclusion, skipping and non-regulated events are shown in Additional file 1: Figure S1.
Figure 2
Figure 2
Chromatin-based RNA-map. (A) Each boxplot represents the relative change in signal densities as z-score values correlated with inclusion or skipping exons for the selected attributes, separated according to whether they show enrichment in skipping exons (red) or in inclusion exons (blue). The plots show the Kolmogorov-Smirnov test P-value for the comparisons of the distributions for each attribute. The exon triplet diagram in the middle shows the regions of the selected attributes (Additional file 1: Table S6). (B) Receiver operating characteristic (ROC) curves and precision-recall curves for the ADTree model, separated for inclusion (blue) and skipping exons (red). We indicate the average area under the ROC curve (0.735), precision (0.687) and recall (0.686) for both classes from the 10-fold cross-validation of the model (Additional file 1: Table S7). ADTree, Alternate Decision tree.
Figure 3
Figure 3
Read profiles on regulated events. Density differences between MCF7 and MCF10, measured as the log2-ratio of RPKM values (y-axis) in (A) the I2 region for CTCF in skipped exons (red), inclusion exons (blue) and non-regulated exons (gray) (Kolmogorov-Smirnov test P-value <0.01 for all comparisons); and in (B) the region w5 for HP1α, in skipped exons (red), inclusion exons (blue) and non-regulated exons (gray) (Kolmogorov-Smirnov test P-value <0.01 for all comparisons). Profiles for HP1α and CTCF in MCF7 (C) and MCF10 (D) around 5′ splice-sites. The profiles show the mean read densities (y-axis) from -600 bp to 600 bp (x-axis) centered at the 5′ss of the regulated alternative exon (E2) for both ChIP-Seq samples, separately for skipped exons (red), included exons (blue) and non-regulated exons (gray). ChIP-Seq, chromatin immunoprecipitation-sequencing; CTCF, CCCTC-binding factor; HP1, heterochromatin protein 1.
Figure 4
Figure 4
Association between HP1α and CTCF binding sites. (A) Graph of significant genome-wide associations between AGO1, CTCF, HP1α, RNAPII and 5metC binding sites. The black double arrows indicate the significant associations between HP1α and CTCF, HP1α and 5metC and CTCF and RNAPII, whereas the directional gray arrows indicate the significant one-sided associations (Additional file 1: Table S8). The number beside each arrow indicates the proportion of clusters (rounded to the closest integer) that overlap with the sites of the factors connected by the arrow. (B) Mean densities of HP1α clusters centered at CTCF clusters (blue line), compared with randomized HP1α clusters (dashed blue line); and mean densities of CTCF clusters (green line) centered at the HP1α clusters, compared with randomized CTCF clusters (dashed green line). Randomized clusters were calculated by relocating each cluster in an arbitrary new position in the same chromosome, avoiding satellites, gaps, pericentromeric regions and the overlap with any other random cluster. AGO1, argonaute 1 protein; CTCF, CCCTC-binding factor; HP1, heterochromatin protein 1; RNAPII, RNA polymerase II; 5metC, 5-methycytosine.
Figure 5
Figure 5
Consensus motifs for CTCF (A) and HP1α (B). Motifs were built using the top 10 heptamers from significant CTCF and HP1α clusters (Methods). CTCF, CCCTC-binding factor; HP1, heterochromatin protein 1.

References

    1. Wang ET, Sandberg R, Luo S, Khrebtukova I, Zhang L, Mayr C, et al. Alternative isoform regulation in human tissue transcriptomes. Nature. 2008;456:470–6. doi: 10.1038/nature07509. - DOI - PMC - PubMed
    1. Pan Q, Shai O, Lee LJ, Frey BJ, Blencowe BJ. Deep surveying of alternative splicing complexity in the human transcriptome by high-throughput sequencing. Nat Genet. 2008;40:1413–5. doi: 10.1038/ng.259. - DOI - PubMed
    1. Padgett RA. New connections between splicing and human disease. Trends Genet. 2012;28:147–54. doi: 10.1016/j.tig.2012.01.001. - DOI - PMC - PubMed
    1. Alló M, Schor IE, Muñoz MJ, de la Mata M, Agirre E, Valcárcel J, et al. Chromatin and alternative splicing. Cold Spring Harb Symp Quant Biol. 2010;75:103–11. doi: 10.1101/sqb.2010.75.023. - DOI - PubMed
    1. Luco RF, Alló M, Schor IE, Kornblihtt AR, Misteli T. Epigenetics in alternative pre-mRNA splicing. Cell. 2011;144:16–26. doi: 10.1016/j.cell.2010.11.056. - DOI - PMC - PubMed

Publication types