. 2015 May 26;43(10):4893-908.
doi: 10.1093/nar/gkv394. Epub 2015 Apr 30.

MDC1 functionally identified as an androgen receptor co-activator participates in suppression of prostate cancer

Affiliations

MDC1 functionally identified as an androgen receptor co-activator participates in suppression of prostate cancer

Chunyu Wang et al. Nucleic Acids Res. .

Abstract

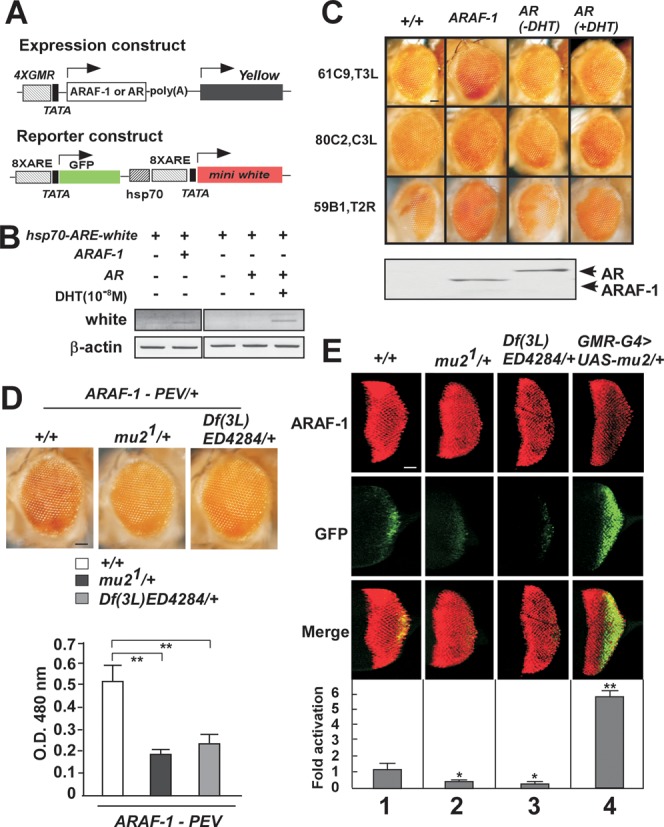
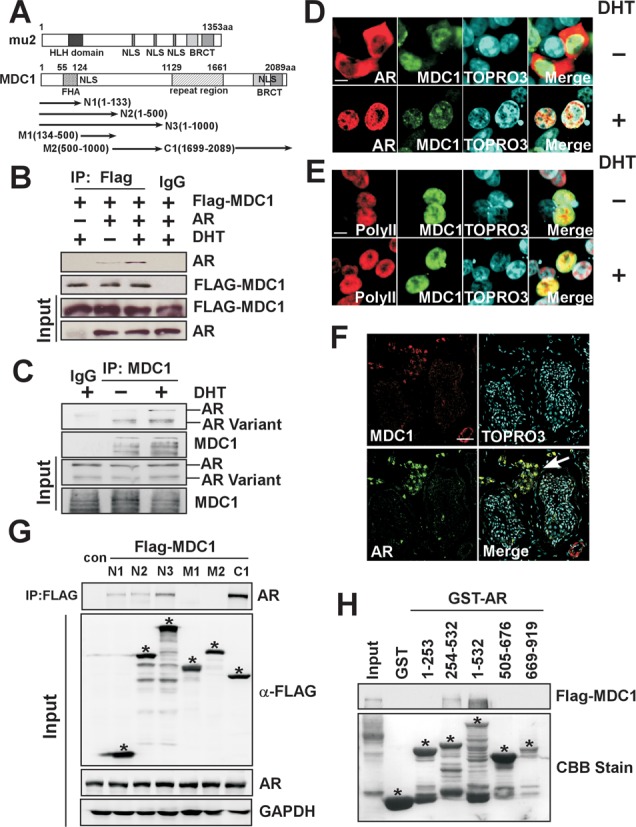
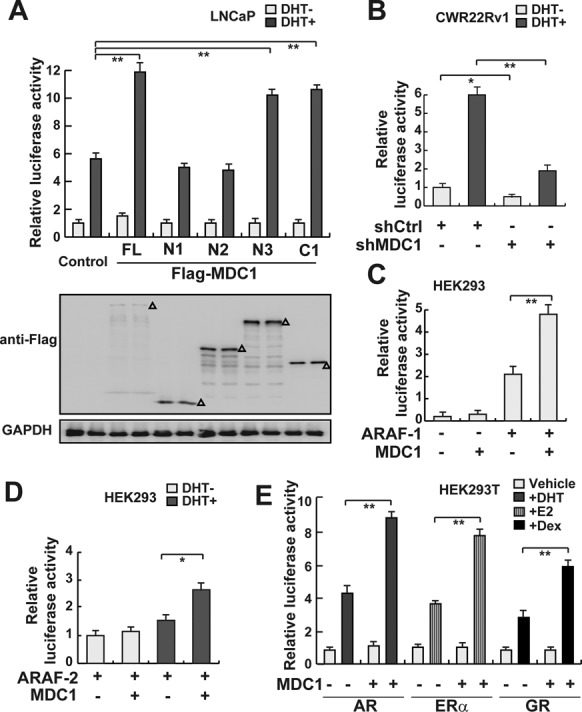
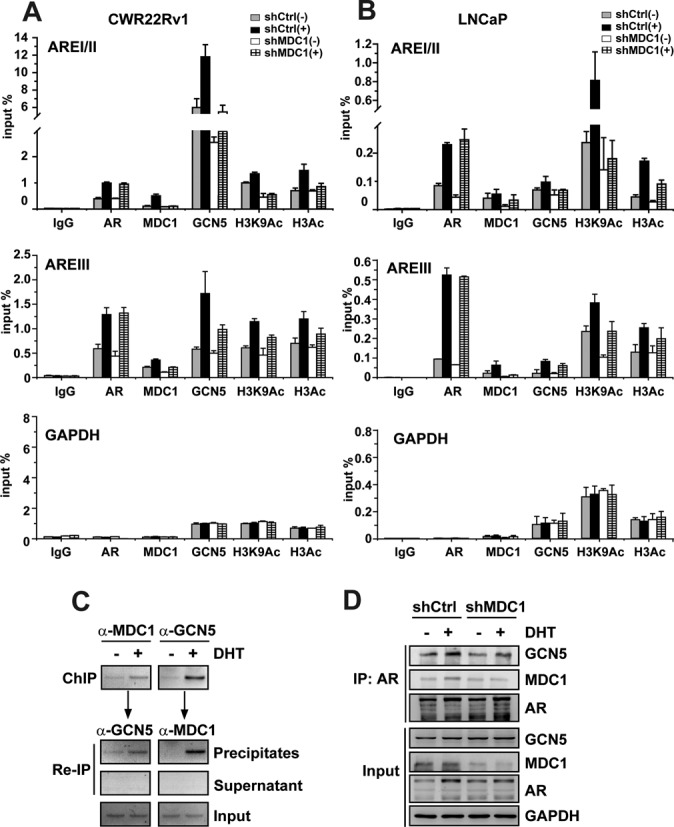
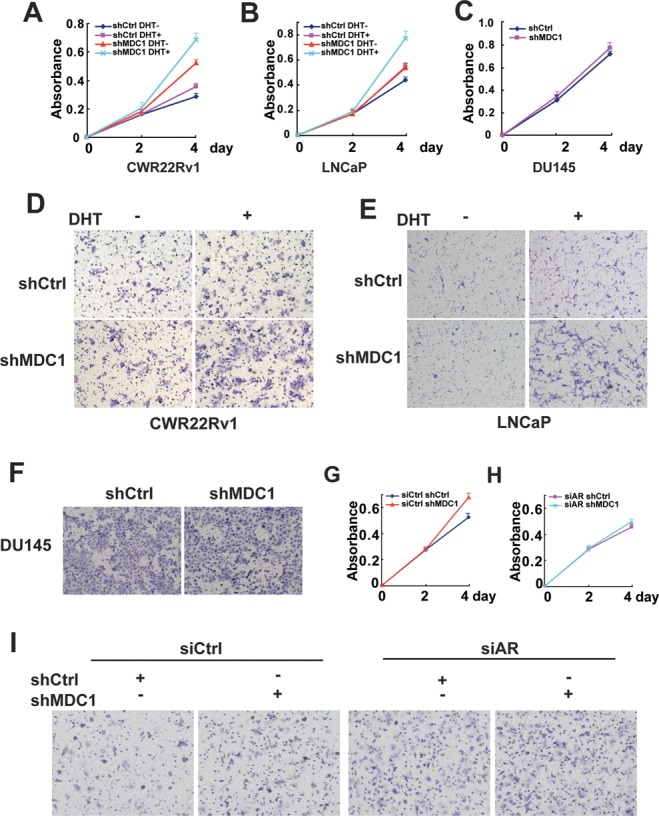
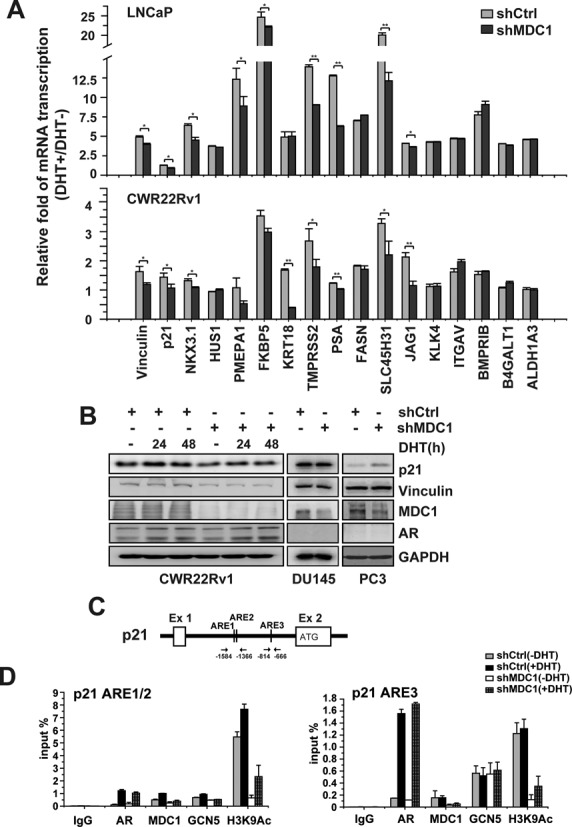
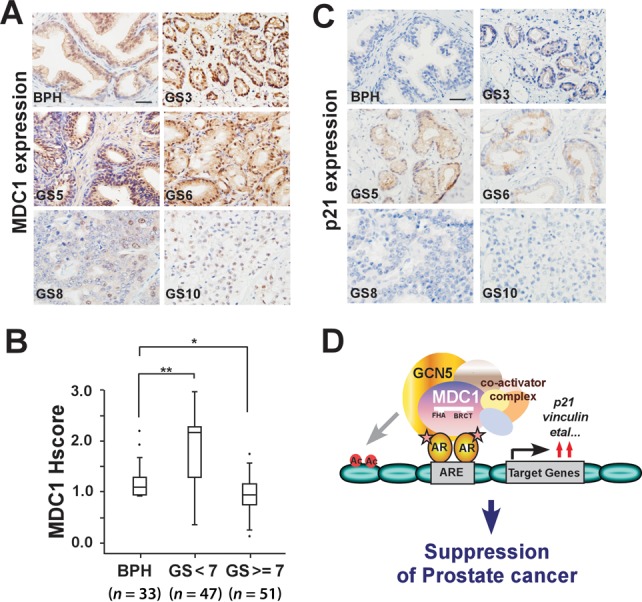
Mediator of DNA damage checkpoint protein 1 (MDC1) is essential for DNA damage response. However, the role of MDC1 in modulating gene transcription independently of DNA damage and the underlying mechanisms have not been fully defined. Androgen receptor (AR) is the central signaling pathway in prostate cancer (PCa) and its target genes are involved in both promotion and suppression of PCa. Here, we functionally identified MDC1 as a co-activator of AR. We demonstrate that MDC1 facilitates the association between AR and histone acetyltransferase GCN5, thereby increasing histone H3 acetylation level on cis-regulatory elements of AR target genes. MDC1 knockdown promotes PCa cells growth and migration. Moreover, depletion of MDC1 results in decreased expression of a subset of the endogenous androgen-induced target genes, including cell cycle negative regulator p21 and PCa metastasis inhibitor Vinculin, in AR positive PCa cell lines. Finally, the expression of MDC1 and p21 correlates negatively with aggressive phenotype of clinical PCa. These studies suggest that MDC1 as an epigenetic modifier regulates AR transcriptional activity and MDC1 may function as a tumor suppressor of PCa, and provide new insight into co-factor-AR-signaling pathway mechanism and a better understanding of the function of MDC1 on PCa.


Figures

Figure 1.
Figure 1.
Drosophila mu2 enhances ARAF-1-induced transactivation. (A) Schematic representation of the expression and reporter constructs in ARAF-1-PEV fly lines as previous reported. The expression constructs include the human androgen receptor (AR) or ARAF-1 driven by four copies of GMR binding sites. The reporter construct harbors GFP and white reporter genes individually controlled by the hsp70 promoter in which eight AREs were introduced. (B) The expression and reporter constructs were co-transfected into S2 cells, mRNA transcription levels of white gene were detected by RT-PCR. (C) Eye phenotypes of three kinds of fly lines for AR-PEV experimental models. Cytogenetic localization of the reporter gene carrying hsp70-ARE-white in Drosophila chromosome was analyzed by inverse PCR. Scale bar, 100 μm. (D) Two different fly lines carrying mu2 loss of function (Mu21/+) or difficiency line including mu2 gene location (Df[3L]ED4284) or wild-type flies (+/+) were crossed with ARAF-1-PEV flies. Modification of PEV was analyzed by areas of eye pigmentation in the progeny (upper panels) and by optical density (OD) measurement at 480nm (lower panels). Average values of more than three independent measurements are shown with SD. Scale bar, 100 μm. **, P < 0.01. (E) Flies expression ARAF-1 in the eye with a GMR-GAL4 driver and carrying an ARE-GFP reporter in pericentric heterochromatin were crossed with lines harboring mu2 loss of function (mu21, Df[3L]ED4284) or gain of function (UAS-mu2) mutants as indicated. Expression of ARAF-1 was assessed by immunostaining with an anti-AR antibody (upper panels). The effect of mu2 mutations and overexpression on ARAF-1-induced transactivation was assessed by examination GFP expression (middle panels). Merge images were shown in lower panels. Scale bar, 100 μm. *, P < 0.05; **, P < 0.01.
Figure 2.
Figure 2.
Interaction between MDC1 and AR. (A) Schemetic representation of Drosophila mu2, its ortholog in human (MDC1) and the truncated mutations of MDC1 (N1, N2, N3, M1, M2 and C1). HLH domain, NLS and BRCT domain; FHA domain, NLS, repeat sequence and BRCT domain were individually positioned in the mu2 and MDC1 proteins. (B) Exogenous MDC1 associates with AR invivo. HEK293T cells co-transfected with Flag-MDC1 and AR expression plasmids were immunoprecipitated using anti-Flag antibody or IgG as a control with or without DHT treatment for 48 h. Precipitated proteins were examined by immunoblotting using antibody against AR N-20. A fraction (5%) of the input cell lysate before immunoprecipitation was loaded as a control. (C) Endogenous MDC1 interacts with AR and N-terminal AR variants in CWR22Rv1 cells. With or without DHT treatment for 24 h, CWR22Rv1 cells were collected and cell lysates were immunoprecipitated with MDC1 antibodies or IgG. Precipitates were analyzed by western blot using the indicated antibodies. (D and E) Confocal fluorescence analysis of subcellular distribution of MDC1 and AR. HEK293T cells were co-transfected with plasmids expressing Flag-MDC1 and AR in the absence or presence of DHT (10−8 M) and then were stained with TOPRO3 to visualize the nucleus (blue), Flag antibody (green), AR (N-20) antibody (red in D) or RNA polymerse II antibody (red in E). Merged images were shown as indicated. Scale bar, 5 μm. (F) Distribution of the endogenous MDC1 and AR in normal human testis. Immunofluorescence analyze of normal testis section was shown. The normal testis tissue was stained with TOPRO3 to visualize DNA (Blue), anti-AR (N-20) (green) and anti-MDC1 (red) antibodies. The arrow in the merged image showed the co-compartmentalization of AR and MDC1. Scale bar, 100 μm. (G) The truncated mutants of MDC1 associate with the endogenous AR. Immunoprecipitation was performed with the indicated LNCaP cell lysates using an anti-Flag antibody. Precipitated proteins and the input of cell lysates were analyzed by immunoblotting with the indicated antibodies. * was placed to indicate the position of the specific FLAG-MDC1 truncated mutant proteins. (H) Identification of binding domains in AR for MDC1 interaction. In GST pull-down experiments, Flag-MDC1 protein synthesized by transcription and translation Kit invitro was incubated with GST and GST-AR deletion mutants as indicated. Bound proteins were analyzed by immunoblotting using anti-Flag antibody and equal loading of GST-AR deletion mutants was assessed by coomassie brilliant blue staining. * was placed to indicate the position of the specific GST-AR deletion mutant proteins.
Figure 3.
Figure 3.
MDC1 co-activates AR-mediated transactivation. (A) MDC1 enhances AR-mediated transactivation and both 500–1000 aa fragment and 1699–2089 aa fragment are required for its function. LNCaP cells were co-transfected with ARE-luc and pRL-TK, together with the indicated expression plasmids in the absence or presence of DHT. The expression of MDC1 truncated mutations were evaluated by western blot as indicated by Δ. (B) MDC1 knockdown represses AR-mediated transactivation in CWR22Rv1 cells. CWR22Rv1 cells with knockdown of MDC1 by shRNA were co-transfected with ARE-luc and pRL-TK in the absence or presence of DHT. (C) MDC1 enhances ARAF-1-mediated transactivation. HEK293 cells were co-transfected with ARE-luc and pRL-TK, together with the indicated expression plasmids in the absence or presence of DHT. (D) MDC1 enhances ARAF-2-mediated transactivation in the presence of DHT. HEK293 cells were co-transfected with ARE-luc and pRL-TK, together with the indicated expression plasmids in the absence or presence of DHT. (E) MDC1 enhances AR, ERα or GR-mediated transactivation. HEK293T Cells were co-transfected with plasmids expressing MDC1 and pRL-TK, together with AR, ERα or GR expression plasmids and their reporter gene plasmids in the absence (white bars) or presence (shadow bars) of relevant ligands. After 24 h of ligand treatment, cells were collected and assayed for luciferase activity. Relative luciferase units shown are the mean value at least three times. In A–E, error bars represent mean ± SD. *P < 0.05; **P < 0.01.
Figure 4.
Figure 4.
Down-expression of MDC1 attenuates GCN5 recruitment to cis-regulatory elements of AR target genes. (A and B) MDC1 knockdown reduces the epigenetic modification and GCN5 recruitment at androgen responsive elements (AREI/II and AREIII) of AR target genes. CWR22Rv1 or LNCaP cells with knockdown of MDC1 by shRNA were incubated with or without DHT for 4 h and were subject to ChIP assay with antibodies indicated. The precipitated androgen responsive elements of PSA were normalized to input DNA signal as a percentage. Data represents the mean values (±SD) of triplicate real-time PCR. IgG was used as a nonspecific control ChIP. GAPDH promoter regions were used as negative control. (C) MDC1 and GCN5 are predominantly recruited to cis-regulatory elements of KLK2 in the presence of DHT. ChIP/re-ChIP experiments were performed using specific antibodies against MDC1 and GCN5 as indicated. (D) MDC1 knockdown reduces the GCN5 recruitment to AR. CWR22Rv1 cells were immunoprecipitated using anti-AR antibody. Precipitated protein complex were immunoblotting using anti-MDC1, anti-GCN5 or anti-AR antibodies to detect the endogenous proteins. A fraction of the input cell lysate before immunoprecipitation was loaded as a control.
Figure 5.
Figure 5.
Knockdown MDC1 promotes prostate cancer cell growth and migration. (A and B) Knockdown of MDC1 promotes cell proliferation of CWR22Rv1 and LNCaP. (C) Knockdown of MDC1 mildly promotes cell proliferation DU145. In A–C, absorbance at 450 nm was plotted. Points, mean of three replicates; bars, SD. (D, E and F) Knockdown of MDC1 promotes migration of CWR22Rv1, but not DU145. In D and E, CWR22Rv1 or LNCaP cells with stably knockdown of MDC1 or control cells were plated into transwell chamber by DHT treatment or not, and detected after 20 or 40 h. DU145 cells with stably knockdown of MDC1 or control cells were plated into transwell chamber and detected after 16 h. Scale bar, 100 μm. (G and H) Enhanced proliferation of CWR22Rv1 cells by MDC1 knockdown was impaired by AR knockdown. CWR22Rv1 with stably knockdown of MDC1 or control cells were transfected with control siRNA (in G) and siAR (in H). After 24 h, cells were plated in 96-well plates and incubated in the presence of DHT. (I) Enhanced migration of CWR22Rv1 cells by MDC1 knockdown was impaired by AR knockdown. CWR22Rv1 with stably knockdown of MDC1 or control cells were transfected with control siRNA and siAR in the presence of DHT. After 48 h, cells were plated into transwell chambers and detected after 20 h.
Figure 6.
Figure 6.
Knockdown MDC1 inhibits androgen induction of AR target genes. (A) Real-time PCR analysis showing the effect of MDC1 knockdown on DHT-dependent activation of 17 AR target genes. LNCaP or CWR22Rv1 cells were infected with either control shRNA lentivirus (shCtrl) or shRNA against MDC1 lentivirus (shMDC1), and treated with or without ligand (DHT). The cells were collected for RNA isolation after DHT treatment for 24 h. Induction of mRNA expression was expressed as the ratio of target gene mRNA levels normalized to β-Actin levels between cells treated and untreated DHT. *P < 0.05; **P < 0.01. (B) MDC1 knockdown diminishes DHT induced p21 and Vinculin expression in CWR22Rv1 cells. Western blot analysis in the whole cell lysates of CWR22RV1, DU145 or PC3 cells with shMDC1 or control shCtrl as indicated. (C) Schemetic representation of putative AREs in p21. (D) MDC1 affects the epigenetic changes and GCN5 recruitment at putative AREs of p21. CWR22Rv1 cells with knockdown of MDC1 by shRNA were incubated with or without DHT for 4 h and were subject to ChIP assay with antibodies indicated. The precipitated chromatin was normalized to input DNA signal as a percentage. Data represents the mean values (±SD) of triplicate real-time PCR. The precipitated chromatin was amplified by real-time qPCR using primers flanking p21 ARE1/2 (−1584 to −1366 bp) and p21 ARE3 (−814 to −666 bp).
Figure 7.
Figure 7.
The expression of MDC1 in clinical specimens. (A) Representative images of MDC1 immunohistochemical staining in PCa (Gleason score [GS] 3, 5, 6, 8 and 10) compared with benign prostate hyperplasia (BPH). Scale bar, 25 μm. (B) MDC1 expression in PCa (GS < 7, GS ≥ 7) compared with BPH. Mann–Whitney U test was used for statistical significance. The MDC1 expression scores were shown as box plots, with the horizontal lines representing the median; the bottom and top of the boxes representing the 25th and 75th percentiles, respectively; and the vertical bars representing the range of data. Extreme cases were marked with a dot. *P < 0.05; **P < 0.01. (C) Representative images of p21 immunohistochemical staining in PCa. Scale bar, 25 μm. (D) Schematic representation of MDC1 co-activator functions on AR-induced transactivation and suppression of prostate cancer.

Similar articles

Cited by

References

    1. Xu K., Wu Z.J., Groner A.C., He H.H., Cai C., Lis R.T., Wu X., Stack E.C., Loda M., Liu T., et al. EZH2 oncogenic activity in castration-resistant prostate cancer cells is Polycomb-independent. Science. 2012;338:1465–1469. - PMC - PubMed
    1. Wang Q., Li W., Zhang Y., Yuan X., Xu K., Yu J., Chen Z., Beroukhim R., Wang H., Lupien M., et al. Androgen receptor regulates a distinct transcription program in androgen-independent prostate cancer. Cell. 2009;138:245–256. - PMC - PubMed
    1. Yu J., Mani R.S., Cao Q., Brenner C.J., Cao X., Wang X., Wu L., Li J., Hu M., Gong Y., et al. An integrated network of androgen receptor, polycomb, and TMPRSS2-ERG gene fusions in prostate cancer progression. Cancer Cell. 2010;17:443–454. - PMC - PubMed
    1. Yeh S., Hu Y.C., Rahman M., Lin H.K., Hsu C.L., Ting H.J., Kang H.Y., Chang C. Increase of androgen-induced cell death and androgen receptor transactivation by BRCA1 in prostate cancer cells. Proc. Natl. Acad. Sci. U.S.A. 2000;97:11256–11261. - PMC - PubMed
    1. Chng K.R., Chang C.W., Tan S.K., Yang C., Hong S.Z., Sng N.Y., Cheung E. A transcriptional repressor co-regulatory network governing androgen response in prostate cancers. EMBO J. 2012;31:2810–2823. - PMC - PubMed

Publication types

MeSH terms