. 2015 May 26;43(10):5033-51.
doi: 10.1093/nar/gkv331. Epub 2015 Apr 30.

The transcriptional PPARβ/δ network in human macrophages defines a unique agonist-induced activation state

Affiliations

The transcriptional PPARβ/δ network in human macrophages defines a unique agonist-induced activation state

Till Adhikary et al. Nucleic Acids Res. .

Abstract

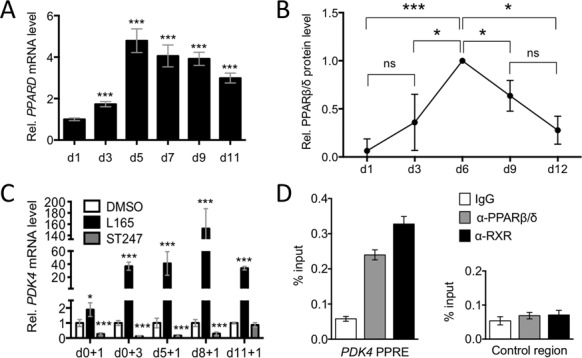
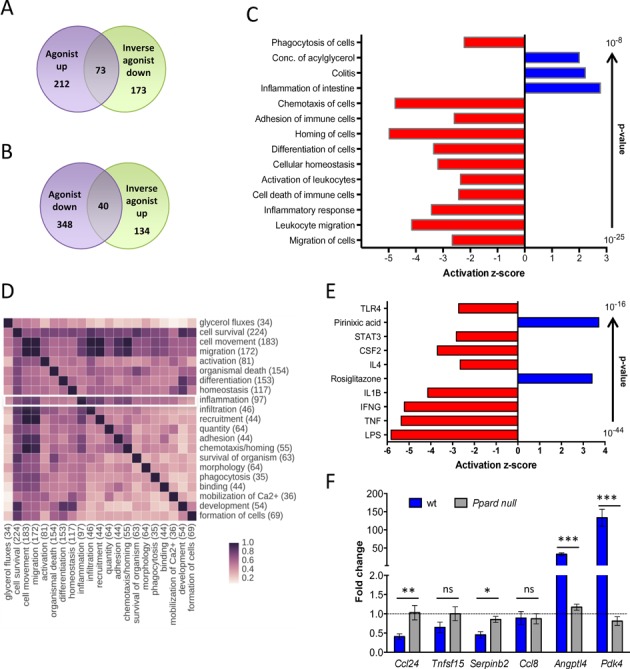
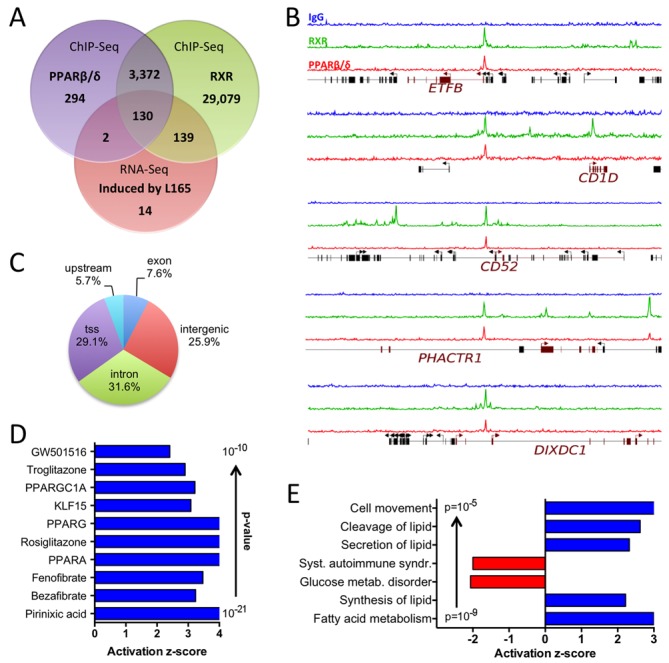
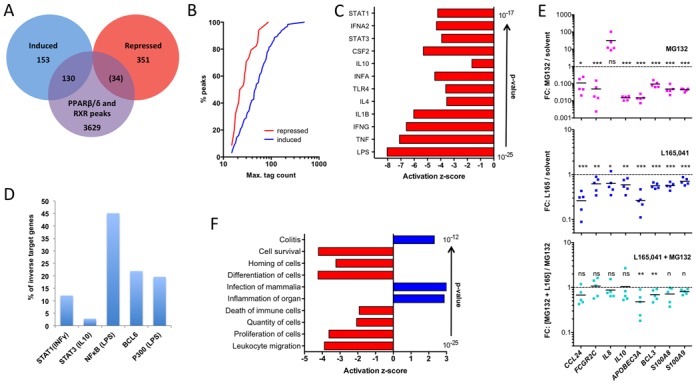
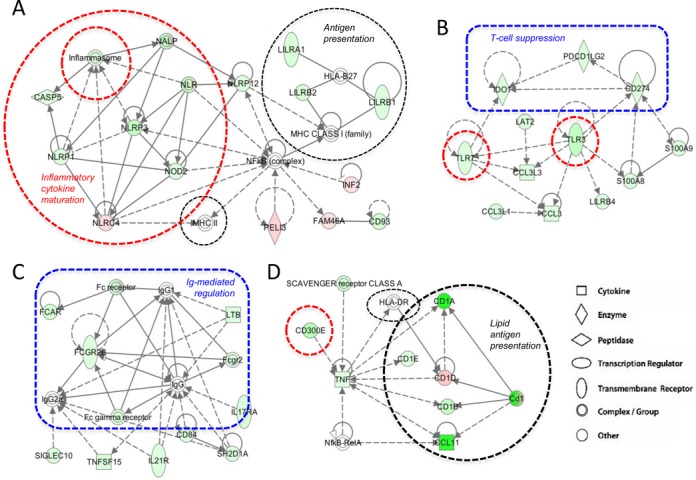
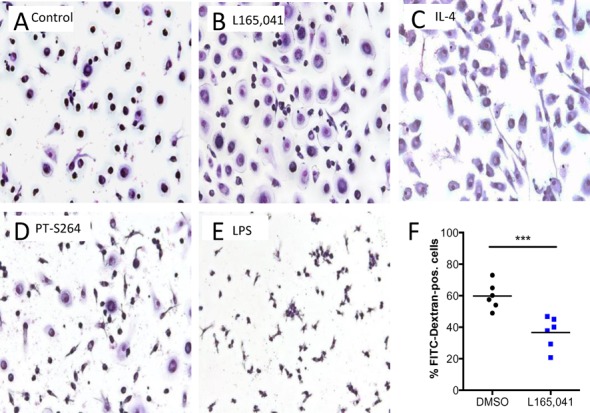
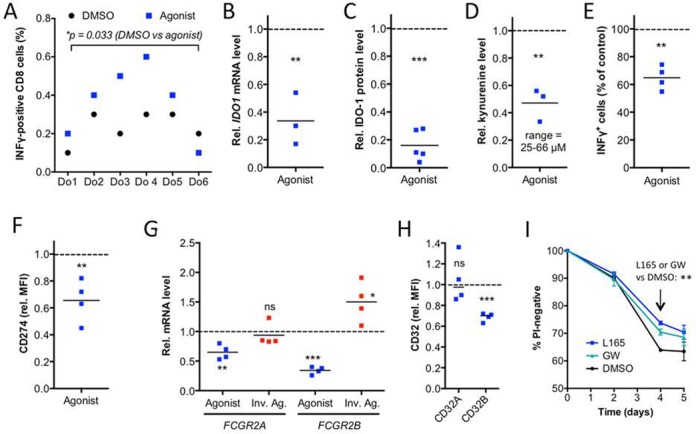
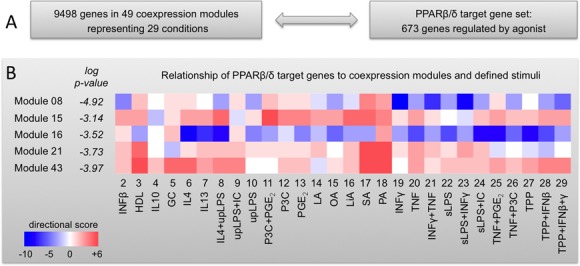
Peroxisome proliferator-activated receptor β/δ (PPARβ/δ) is a lipid ligand-inducible transcription factor with established metabolic functions, whereas its anti-inflammatory function is poorly understood. To address this issue, we determined the global PPARβ/δ-regulated signaling network in human monocyte-derived macrophages. Besides cell type-independent, canonical target genes with metabolic and immune regulatory functions we identified a large number of inflammation-associated NFκB and STAT1 target genes that are repressed by agonists. Accordingly, PPARβ/δ agonists inhibited the expression of multiple pro-inflammatory mediators and induced an anti-inflammatory, IL-4-like morphological phenotype. Surprisingly, bioinformatic analyses also identified immune stimulatory effects. Consistent with this prediction, PPARβ/δ agonists enhanced macrophage survival under hypoxic stress and stimulated CD8(+) T cell activation, concomitantly with the repression of immune suppressive target genes and their encoded products CD274 (PD-1 ligand), CD32B (inhibitory Fcγ receptor IIB) and indoleamine 2,3-dioxygenase 1 (IDO-1), as well as a diminished release of the immune suppressive IDO-1 metabolite kynurenine. Comparison with published data revealed a significant overlap of the PPARβ/δ transcriptome with coexpression modules characteristic of both anti-inflammatory and pro-inflammatory cytokines. Our findings indicate that PPARβ/δ agonists induce a unique macrophage activation state with strong anti-inflammatory but also specific immune stimulatory components, pointing to a context-dependent function of PPARβ/δ in immune regulation.


Figures

Figure 1.
Figure 1.
PPARβ/δ expression and activity in differentiating human MDMs. Human monocytes were differentiated in R10 medium for 11 days and analyzed at the indicated times after initiation of differentiation. (A) Expression of PPARD mRNA measured by RT-qPCR relative d1 (sample size = 3). (B) Quantitation of immunoblot analyses of PPARβ/δ protein expression in differentiating MDMs from four different donors relative to LDH (loading control). The individual blots are shown in Supplementary Figure S1. Values were normalized to 1.0 on d6 (maximum expression). (C) Ligand-mediated induction relative to DMSO of PDK4 determined by RT-qPCR. Cells (sample size = 3) were exposed to L165,041 for 1 or 3 days (+1 or +3) at the indicated d (d0, d5, d8, d11). (D) PPARβ/δ and RXR enrichment at the PDK4 enhancer at −12 kb from the transcription start site and an irrelevant control region (Con) in human monocytes (ChIP analysis; sample size = 6). Statistical significance was tested relative to d0 (panel (A)) or DMSO (panel (C)).
Figure 2.
Figure 2.
Genome-wide identification of PPARβ/δ target genes in macrophages. (A) Overlap of genes induced by L165,041 and repressed by ST247 or PT-S264 in MDMs cultured for 6 days followed by treatment with DMSO or ligands for 24 h. Data are derived from two independent experiments using either R10 (L165,041, ST247) or XV0 (L165,041, PT-S264) medium. Genes with a logFC > 0.7 in one culture condition, a logFC > 0 in both media, an FPKM ≥ 0.3 and a raw tag count of at least 50 were scored as positive. (B) Overlap of genes repressed by L165,041 and activated by ST247 in MDMs (conditions as in (A)). (C) IPA ‘Diseases and Functions Annotation’ of L165,041-regulated genes (examples of functionally different clusters with low P-values and high z-scores). (D) Overlap of L165,041-regulated genes linked to different functions (according to IPA ‘Diseases and Functions Annotation’; all clusters with n > 30 genes). (E) IPA ‘Upstream Regulator Analysis’ of L165,041-regulated genes (top regulators by P-value). (F) RT-qPCR analysis of target gene regulation by the PPARβ/δ agonist GW501516 in BMDMs from wild-type and Ppard null mice differentiated for 6 days in the presence of GM-CSF (sample size: 3 each). The data show the fold change (mean of triplicates) in response to the ligand relative to solvent treated wild-type and Ppard null control cells.
Figure 3.
Figure 3.
Genome-wide identification of agonist-induced direct PPARβ/δ target genes in MDMs. (A) Overlap of genes associated with PPARβ/δ and RXR binding sites in MDMs (ChIP-Seq; peaks filtered and associated with genes as described in the Materials and Methods section) and L165,041-induced genes (RNA-Seq). (B) Examples of RXR (green) and PPARβ/δ (red) enrichment peaks at novel canonical target genes (ChIP-Seq data). Blue: control IgG. (C) Locations of PPARβ/δ sites identified by ChIP-Seq. tss: within 1250 bp of a transcription start site; upstream: within 5 kb upstream of a transcription start site. (D) IPA ‘Upstream Regulator Analysis’ of L165,041-induced genes (top regulators by P-value). (E) IPA ‘Diseases and Functions Annotation’ of L165,041-induced genes in MDMs.
Figure 4.
Figure 4.
Genome-wide identification of agonist-repressed (inverse) PPARβ/δ target genes. (A) Overlap of genes associated with PPARβ/δ and RXR binding sites in MDMs with L165,041-regulated genes. Number in parentheses indicates low enrichment sites. (B) Cumulative read distribution for all PPARβ/δ binding sites separated into agonist induced and agonist repressed genes. Plotted is the percentage of reads with n or fewer reads in PPARβ/δ ChIP-Seq analyses. (C) IPA ‘Upstream Regulator Analysis’ of L165,041-repressed genes (top regulators by P-value). (D) Percentage of inverse PPARβ/δ target genes in MDMs (this study) with published binding sites (ChIP-Seq) for STAT1 (INFγ induced) (41), STAT3 (IL-10 induced) (42), NFκB-p65 (24), BCL-6 (24) (43) or P300 (LPS-induced). (E) Effect (fold change) of MG132 (10 μM), L165,041 or a combination of both compounds on inverse target genes with ‘bona fide’ NFκB binding sites (24-h treatment) in MDMs from five donors. T-tests of the corresponding groups in the two L165,041 panels against each other showed a statistical significance for CCL24 (P < 0.05). (F) IPA ‘Diseases and Functions Annotation’ of L165,041-repressed genes in MDMs.
Figure 5.
Figure 5.
Effects of L165,041 on immune regulatory modules. The scheme displays functional modules derived from the IPA ‘Functional Network Analysis’ (Supplementary Table S6; modules 2, 3, 4 and 10). Pink symbols: genes upregulated by L165,041; green symbols: genes downregulated by L165,041. Dashed lines: indirect effects or interactions. Encircled areas indicate functional units with pro-inflammatory (red), anti-inflammatory (blue) or context-dependent (black) functions.
Figure 6.
Figure 6.
Inhibitory effects of PPARβ/δ ligands on human MDMs. Human monocytes were differentiated in XV0 medium for 6 days in the presence of the indicated additives. Cells were stained with Giemsa dye after treatment with (A) DMSO (solvent control), (B) L165,041 (agonist), (C) IL-4 (‘M2’ macrophages), (D) PT-S264 (inverse agonist) and (E) LPS (‘M1’ macrophages). (F) Effect of L165,041 on FITC-dextran uptake (FACS analysis) by MDMs. Data of six biological replicates with cells from four different donors are shown.
Figure 7.
Figure 7.
PPARβ/δ ligand-induced immune stimulatory alterations in human MDMs. (A) Effects of L165,041 on T cell activation by the recall antigen peptide mix CEFT. MDMs from six different donors differentiated in the presence of agonist or DMSO (solvent control) were analyzed for their ability to stimulate CEFT-peptide induced INFγ production by co-cultured autologous T cells. The fraction of CD8+IFNγ+ cells was determined by FACS. The experiment was performed with six independent donors (Do1–Do6) showing a CEFT-directed response. (B) RT-qPCR analysis of IDO1 by L165,041 (24 h) in MDMs from three donors relative to DMSO control. Each dot represents the average of technical triplicates. (C) Quantitation of immunoblot analyses of IDO-1 protein expression in L165,041-treated (24 h) MDMs from five different donors relative to DMSO control. Blots are shown in Supplementary Figure S7. (D) Kynurenine production by MDMs from three different donors treated with L165,041 for 24 h relative to DMSO control. (E) Effect of L165,041 on polyclonal T cell activation relative to DMSO control (four different donors). (F) FACS analysis of CD274 expression on MDMs treated with L165,041 or solvent (DMSO) during differentiation (four different donors). (G) RT-qPCR analysis of FCGR2A and FCGR2B expression on MDMs treated with L165,041 or ST247 during differentiation relative to DMSO control (four donors as in (F)). (H) FACS analysis of CD32A and CD32B, conditions as in (F). (I) Effect of PPARβ/δ ligands on the time course of hypoxia-induced cell death. MDMs were cultured in XV0 medium at <1% oxygen for up to 5 days in the presence or absence of L165,041 or GW501516 and analyzed for propidium (PI) uptake by flow cytometry. Data represent the mean of three biological replicates with cells from different donors. Horizontal lines in panels (B–H) and error bars in panel (I) indicate the average.
Figure 8.
Figure 8.
Comparison of the PPARβ/δ transcriptome with a spectrum of defined MDM activation states. (A) Scheme outlining the basis for the comparative analyses. (B) Relationship of PPARβ/δ target genes to expression data obtained with 29 different stimuli grouped into 49 coexpression modules (3). Overlaps between PPARβ/δ target genes and each module were determined by hypergeometric test. Modules yielding P-values <0.001 (modules 8, 15, 16, 21 and 43) were further analyzed by determining for each gene the direction of regulation by L165,041 (Supplementary Table S2) compared to all 29 stimuli (3). Results are displayed for each subset of genes (defined by specific stimulation conditions within individual modules) as a heatmap. The color code is based on a directional score reflecting the number of genes regulated in the same direction (red) or in opposite directions (blue; for details see the Materials and Methods section). GC, glucocorticoid; HDL, high density lipoprotein; IC, immune complexes; LA, lauric acid; LiA, linoleic acid; OA, oleic acid; P3C, Pam3CysSerLys4; PA, palmitic acid; SA, stearic acid; sLPS, standard lipopolysaccharide; TPP, TNFα+PGE2+P3C; upLPS, ultrapure lipopolysaccharide.
Figure 9.
Figure 9.
Identification of common and cell type-specific PPARβ/δ target genes. (A) Overlap of PPARβ/δ binding sites in WPMY-1 myofibroblast-like cells, MDA-MB-231 breast cancer cells and MDMs. Common target genes (n = 129) were analyzed by IPA Diseases and Functions Annotation. The box shows the top term by p-value of overlap. (B) Overlap of agonist-repressed genes. (C) RT-qPCR validation of common and macrophage-specific PPARβ/δ target genes in WPMY-1 and MDA-MB-231 cells. Values were normalized to 1 for untreated cells (solvent only) individually for each gene and cell line. Statistical significance was tested relative to DMSO-treated cells.

References

    1. Sica A., Mantovani A. Macrophage plasticity and polarization: in vivo veritas. J. Clin. Invest. 2012;122:787–795. - PMC - PubMed
    1. Martinez F.O., Gordon S. The M1 and M2 paradigm of macrophage activation: time for reassessment. F1000Prime Rep. 2014;6:13. - PMC - PubMed
    1. Xue J., Schmidt S.V., Sander J., Draffehn A., Krebs W., Quester I., De Nardo D., Gohel T.D., Emde M., Schmidleithner L., et al. Transcriptome-based network analysis reveals a spectrum model of human macrophage activation. Immunity. 2014;40:274–288. - PMC - PubMed
    1. Kostadinova R., Wahli W., Michalik L. PPARs in diseases: control mechanisms of inflammation. Curr. Med. Chem. 2005;12:2995–3009. - PubMed
    1. Yang Y., Lovett-Racke A.E., Racke M.K. Regulation of immune responses and autoimmune encephalomyelitis by PPARs. PPAR Res. 2010;2010:104705. - PMC - PubMed

Publication types