

Neurofilament light chain: A prognostic biomarker in amyotrophic lateral sclerosis
- PMID: 25934855
- PMCID: PMC4456658
- DOI: 10.1212/WNL.0000000000001642
Neurofilament light chain: A prognostic biomarker in amyotrophic lateral sclerosis
Erratum in
-
Neurofilament light chain: a prognostic biomarker in amyotrophic lateral sclerosis.Neurology. 2015 Sep 8;85(10):921. doi: 10.1212/WNL.0000000000001986. Neurology. 2015. PMID: 26346831 Free PMC article. No abstract available.
Abstract
Objective: To test blood and CSF neurofilament light chain (NfL) levels in relation to disease progression and survival in amyotrophic lateral sclerosis (ALS).
Methods: Using an electrochemiluminescence immunoassay, NfL levels were measured in samples from 2 cohorts of patients with sporadic ALS and healthy controls, recruited in London (ALS/control, plasma: n = 103/42) and Oxford (ALS/control, serum: n = 64/36; paired CSF: n = 38/20). NfL levels in patients were measured at regular intervals for up to 3 years. Change in ALS Functional Rating Scale-Revised score was used to assess disease progression. Survival was evaluated using Cox regression and Kaplan-Meier analysis.
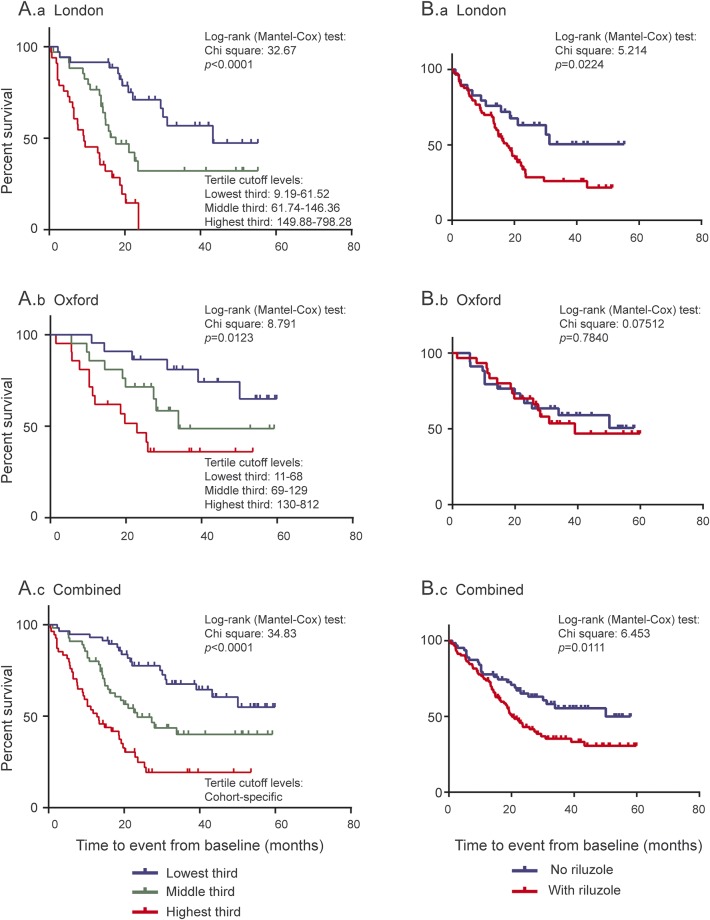
Results: CSF, serum, and plasma NfL discriminated patients with ALS from healthy controls with high sensitivity (97%, 89%, 90%, respectively) and specificity (95%, 75%, 71%, respectively). CSF NfL was highly correlated with serum levels (r = 0.78, p < 0.0001). Blood NfL levels were approximately 4 times as high in patients with ALS compared with controls in both cohorts, and maintained a relatively constant expression during follow-up. Blood NfL levels at recruitment were strong, independent predictors of survival. The highest tertile of blood NfL at baseline had a mortality hazard ratio of 3.91 (95% confidence interval 1.98-7.94, p < 0.001).
Conclusion: Blood-derived NfL level is an easily accessible biomarker with prognostic value in ALS. The individually relatively stable levels longitudinally offer potential for NfL as a pharmacodynamic biomarker in future therapeutic trials.
Classification of evidence: This report provides Class III evidence that the NfL electrochemiluminescence immunoassay accurately distinguishes patients with sporadic ALS from healthy controls.
© 2015 American Academy of Neurology.
Figures


References
-
- Petzold A. Neurofilament phosphoforms: surrogate markers for axonal injury, degeneration and loss. J Neurol Sci 2005;233:183–198. - PubMed
-
- Brettschneider J, Petzold A, Sussmuth SD, Ludolph AC, Tumani H. Axonal damage markers in cerebrospinal fluid are increased in ALS. Neurology 2006;66:852–856. - PubMed
-
- Norgren N, Rosengren L, Stigbrand T. Elevated neurofilament levels in neurological diseases. Brain Res 2003;987:25–31. - PubMed
-
- Rosengren LE, Karlsson JE, Karlsson JO, Persson LI, Wikkelso C. Patients with amyotrophic lateral sclerosis and other neurodegenerative diseases have increased levels of neurofilament protein in CSF. J Neurochem 1996;67:2013–2018. - PubMed
-
- Reijn TS, Abdo WF, Schelhaas HJ, Verbeek MM. CSF neurofilament protein analysis in the differential diagnosis of ALS. J Neurol 2009;256:615–619. - PubMed
Publication types
MeSH terms
Substances
Grants and funding
- MR/K01014X/1/MRC_/Medical Research Council/United Kingdom
- MR/K000780/1/MRC_/Medical Research Council/United Kingdom
- TURNER/JAN13/944-795/MNDA_/Motor Neurone Disease Association/United Kingdom
- FRATTA/JAN15/946-795/MNDA_/Motor Neurone Disease Association/United Kingdom
- MR/J011932/1/MRC_/Medical Research Council/United Kingdom
LinkOut - more resources
Full Text Sources
Other Literature Sources
Medical
Research Materials
Miscellaneous