

Implementation of a model of bodily fluids regulation
- PMID: 25935135
- PMCID: PMC4531145
- DOI: 10.1007/s10441-015-9250-3
Implementation of a model of bodily fluids regulation
Abstract
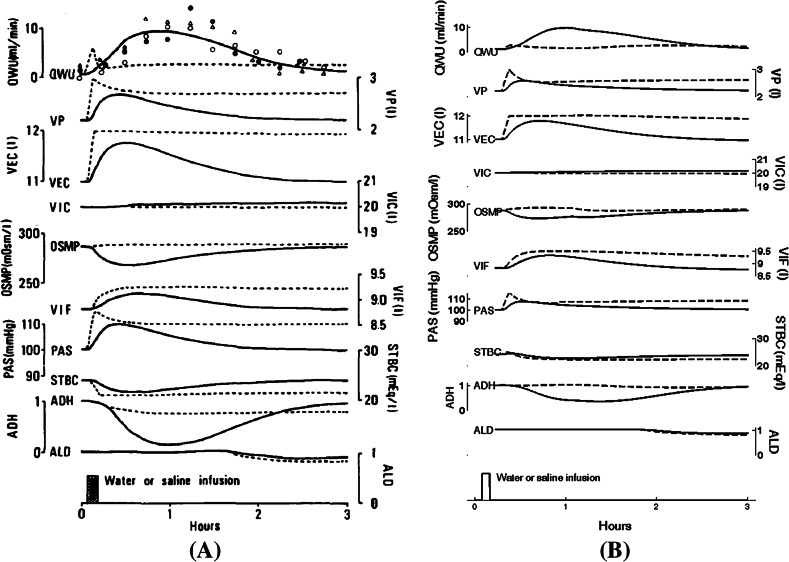
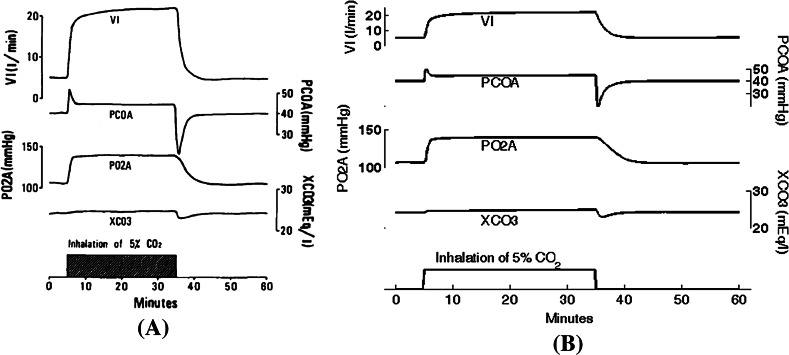
The classic model of blood pressure regulation by Guyton et al. (Annu Rev Physiol 34:13-46, 1972a; Ann Biomed Eng 1:254-281, 1972b) set a new standard for quantitative exploration of physiological function and led to important new insights, some of which still remain the focus of debate, such as whether the kidney plays the primary role in the genesis of hypertension (Montani et al. in Exp Physiol 24:41-54, 2009a; Exp Physiol 94:382-388, 2009b; Osborn et al. in Exp Physiol 94:389-396, 2009a; Exp Physiol 94:388-389, 2009b). Key to the success of this model was the fact that the authors made the computer code (in FORTRAN) freely available and eventually provided a convivial user interface for exploration of model behavior on early microcomputers (Montani et al. in Int J Bio-med Comput 24:41-54, 1989). Ikeda et al. (Ann Biomed Eng 7:135-166, 1979) developed an offshoot of the Guyton model targeting especially the regulation of body fluids and acid-base balance; their model provides extended renal and respiratory functions and would be a good basis for further extensions. In the interest of providing a simple, useable version of Ikeda et al.'s model and to facilitate further such extensions, we present a practical implementation of the model of Ikeda et al. (Ann Biomed Eng 7:135-166, 1979), using the ODE solver Berkeley Madonna.
Figures


Similar articles
-
Body fluid volumes measurements by impedance: A review of bioimpedance spectroscopy (BIS) and bioimpedance analysis (BIA) methods.Med Eng Phys. 2008 Dec;30(10):1257-69. doi: 10.1016/j.medengphy.2008.06.009. Epub 2008 Aug 3. Med Eng Phys. 2008. PMID: 18676172 Review.
-
Contribution of the plasma and lymph Degradome and Peptidome to the MHC Ligandome.Immunogenetics. 2019 Mar;71(3):203-216. doi: 10.1007/s00251-018-1093-z. Epub 2018 Oct 20. Immunogenetics. 2019. PMID: 30343358 Free PMC article. Review.
-
Integration of detailed modules in a core model of body fluid homeostasis and blood pressure regulation.Prog Biophys Mol Biol. 2011 Oct;107(1):169-82. doi: 10.1016/j.pbiomolbio.2011.06.008. Epub 2011 Jun 26. Prog Biophys Mol Biol. 2011. PMID: 21729716
-
Restoration of Guyton´s diagram for regulation of the circulation as a basis for quantitative physiological model development.Physiol Res. 2010;59(6):897-908. doi: 10.33549/physiolres.931838. Epub 2010 Jun 9. Physiol Res. 2010. PMID: 20533860
-
SAPHIR: a physiome core model of body fluid homeostasis and blood pressure regulation.Philos Trans A Math Phys Eng Sci. 2008 Sep 13;366(1878):3175-97. doi: 10.1098/rsta.2008.0079. Philos Trans A Math Phys Eng Sci. 2008. PMID: 18565814
Cited by
-
Extracellular Fluid Excess Is Significantly Associated With Coronary Artery Calcification in Patients With Chronic Kidney Disease.J Am Heart Assoc. 2018 Jun 30;7(13):e008935. doi: 10.1161/JAHA.118.008935. J Am Heart Assoc. 2018. PMID: 29960990 Free PMC article.
-
High sodium intake and fluid overhydration predict cardiac structural and functional impairments in chronic kidney disease.Front Nutr. 2024 May 27;11:1388591. doi: 10.3389/fnut.2024.1388591. eCollection 2024. Front Nutr. 2024. PMID: 38860161 Free PMC article.
-
A neuromorphic device mimicking synaptic plasticity under different body fluid K+ homeostasis for artificial reflex path construction and pattern recognition.Fundam Res. 2022 Apr 29;4(2):353-361. doi: 10.1016/j.fmre.2022.03.024. eCollection 2024 Mar. Fundam Res. 2022. PMID: 38933504 Free PMC article.
-
Dynamic analysis of the individual patterns of intakes, voids, and bladder sensations reported in bladder diaries collected in the LURN study.PLoS One. 2023 Nov 20;18(11):e0284544. doi: 10.1371/journal.pone.0284544. eCollection 2023. PLoS One. 2023. PMID: 37983243 Free PMC article.
-
Extracellular fluid excess linked to reduced choroidal vascularity index in patients with chronic kidney disease.Sci Rep. 2024 Jun 4;14(1):12769. doi: 10.1038/s41598-024-63444-7. Sci Rep. 2024. PMID: 38834727 Free PMC article.
References
Publication types
MeSH terms
Substances
LinkOut - more resources
Full Text Sources
Other Literature Sources
Miscellaneous
