

Identification of conserved drought-adaptive genes using a cross-species meta-analysis approach
- PMID: 25935420
- PMCID: PMC4417316
- DOI: 10.1186/s12870-015-0493-6
Identification of conserved drought-adaptive genes using a cross-species meta-analysis approach
Abstract
Background: Drought is the major environmental stress threatening crop-plant productivity worldwide. Identification of new genes and metabolic pathways involved in plant adaptation to progressive drought stress at the reproductive stage is of great interest for agricultural research.
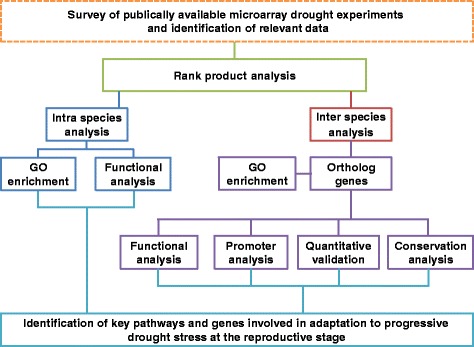
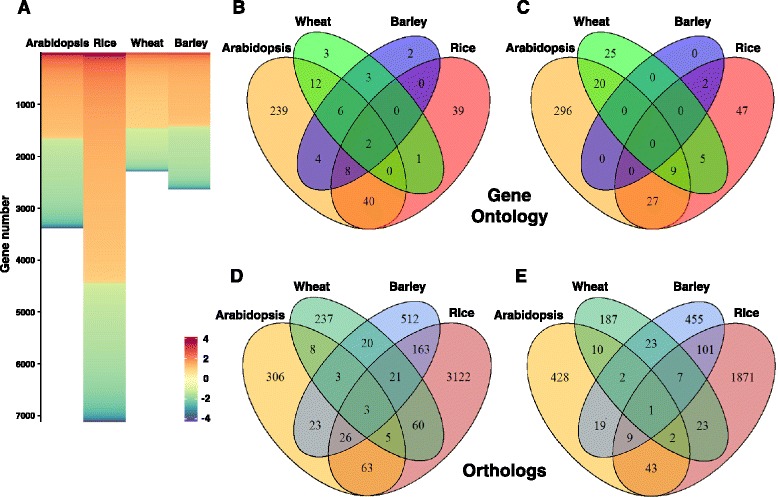
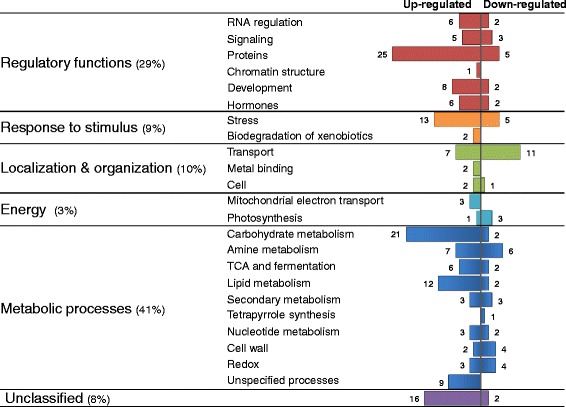
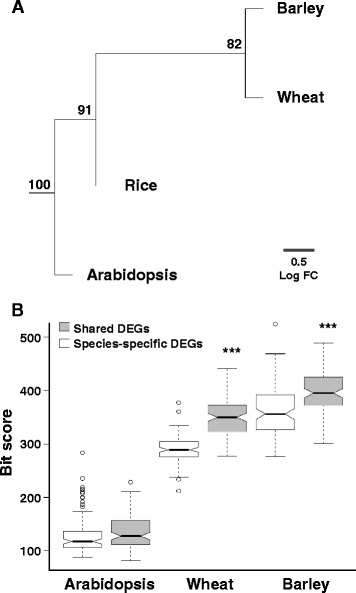
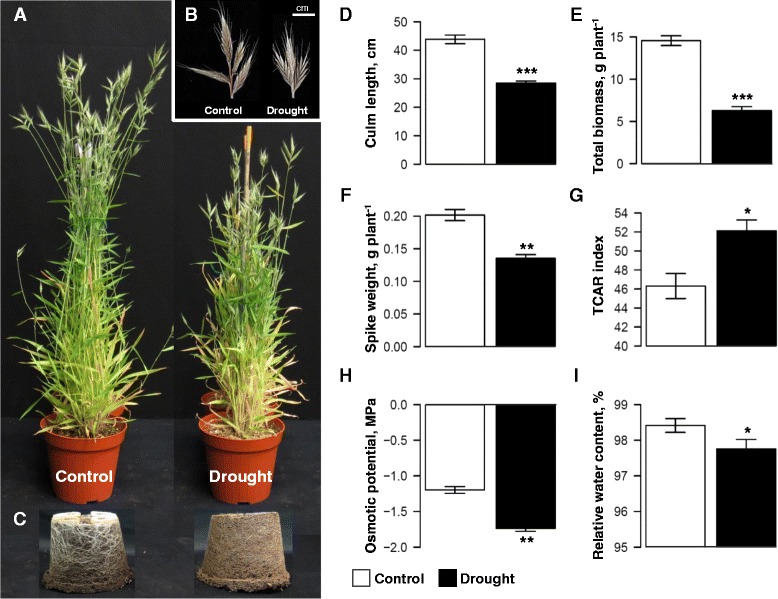
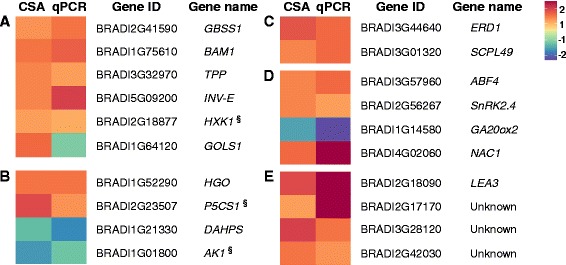
Results: We developed a novel Cross-Species meta-Analysis of progressive Drought stress at the reproductive stage (CSA:Drought) to identify key drought adaptive genes and mechanisms and to test their evolutionary conservation. Empirically defined filtering criteria were used to facilitate a robust integration of 17 deposited microarray experiments (148 arrays) of Arabidopsis, rice, wheat and barley. By prioritizing consistency over intensity, our approach was able to identify 225 differentially expressed genes shared across studies and taxa. Gene ontology enrichment and pathway analyses classified the shared genes into functional categories involved predominantly in metabolic processes (e.g. amino acid and carbohydrate metabolism), regulatory function (e.g. protein degradation and transcription) and response to stimulus. We further investigated drought related cis-acting elements in the shared gene promoters, and the evolutionary conservation of shared genes. The universal nature of the identified drought-adaptive genes was further validated in a fifth species, Brachypodium distachyon that was not included in the meta-analysis. qPCR analysis of 27, randomly selected, shared orthologs showed similar expression pattern as was found by the CSA:Drought.In accordance, morpho-physiological characterization of progressive drought stress, in B. distachyon, highlighted the key role of osmotic adjustment as evolutionary conserved drought-adaptive mechanism.
Conclusions: Our CSA:Drought strategy highlights major drought-adaptive genes and metabolic pathways that were only partially, if at all, reported in the original studies included in the meta-analysis. These genes include a group of unclassified genes that could be involved in novel drought adaptation mechanisms. The identified shared genes can provide a useful resource for subsequent research to better understand the mechanisms involved in drought adaptation across-species and can serve as a potential set of molecular biomarkers for progressive drought experiments.
Figures
Similar articles
-
Cross-species multiple environmental stress responses: An integrated approach to identify candidate genes for multiple stress tolerance in sorghum (Sorghum bicolor (L.) Moench) and related model species.PLoS One. 2018 Mar 28;13(3):e0192678. doi: 10.1371/journal.pone.0192678. eCollection 2018. PLoS One. 2018. PMID: 29590108 Free PMC article.
-
RNA-Seq analysis identifies genes associated with differential reproductive success under drought-stress in accessions of wild barley Hordeum spontaneum.BMC Plant Biol. 2015 Jun 9;15:134. doi: 10.1186/s12870-015-0528-z. BMC Plant Biol. 2015. PMID: 26055625 Free PMC article.
-
Transcriptome sequencing of two wild barley (Hordeum spontaneum L.) ecotypes differentially adapted to drought stress reveals ecotype-specific transcripts.BMC Genomics. 2014 Nov 19;15(1):995. doi: 10.1186/1471-2164-15-995. BMC Genomics. 2014. PMID: 25408241 Free PMC article.
-
Emerging tools, concepts and ideas to track the modulator genes underlying plant drought adaptive traits: An overview.Plant Signal Behav. 2016;11(1):e1074370. doi: 10.1080/15592324.2015.1074370. Plant Signal Behav. 2016. PMID: 26618613 Free PMC article. Review.
-
Plant Epigenetic Stress Memory Induced by Drought: A Physiological and Molecular Perspective.Methods Mol Biol. 2020;2093:243-259. doi: 10.1007/978-1-0716-0179-2_17. Methods Mol Biol. 2020. PMID: 32088901 Review.
Cited by
-
Meta-Analysis of Common and Differential Transcriptomic Responses to Biotic and Abiotic Stresses in Arabidopsis thaliana.Plants (Basel). 2022 Feb 12;11(4):502. doi: 10.3390/plants11040502. Plants (Basel). 2022. PMID: 35214836 Free PMC article.
-
De Novo Assembly and Discovery of Genes That Involved in Drought Tolerance in the Common Vetch.Int J Mol Sci. 2019 Jan 15;20(2):328. doi: 10.3390/ijms20020328. Int J Mol Sci. 2019. PMID: 30650531 Free PMC article.
-
Integrating metabolomics and high-throughput phenotyping to elucidate metabolic and phenotypic responses to early-season drought stress in Nordic spring wheat.BMC Plant Biol. 2025 Jul 30;25(1):987. doi: 10.1186/s12870-025-06914-y. BMC Plant Biol. 2025. PMID: 40739173 Free PMC article.
-
Photosynthetic Performance of Oil Palm Genotypes under Drought Stress.Plants (Basel). 2024 Sep 27;13(19):2705. doi: 10.3390/plants13192705. Plants (Basel). 2024. PMID: 39409575 Free PMC article.
-
RNA-Seq reveals different responses to drought in Neotropical trees from savannas and seasonally dry forests.BMC Plant Biol. 2021 Oct 12;21(1):463. doi: 10.1186/s12870-021-03244-7. BMC Plant Biol. 2021. PMID: 34641780 Free PMC article.
References
Publication types
MeSH terms
LinkOut - more resources
Full Text Sources
Other Literature Sources
