

An Accurate Cancer Incidence in Barrett's Esophagus: A Best Estimate Using Published Data and Modeling
- PMID: 25935635
- PMCID: PMC4550489
- DOI: 10.1053/j.gastro.2015.04.045
An Accurate Cancer Incidence in Barrett's Esophagus: A Best Estimate Using Published Data and Modeling
Abstract
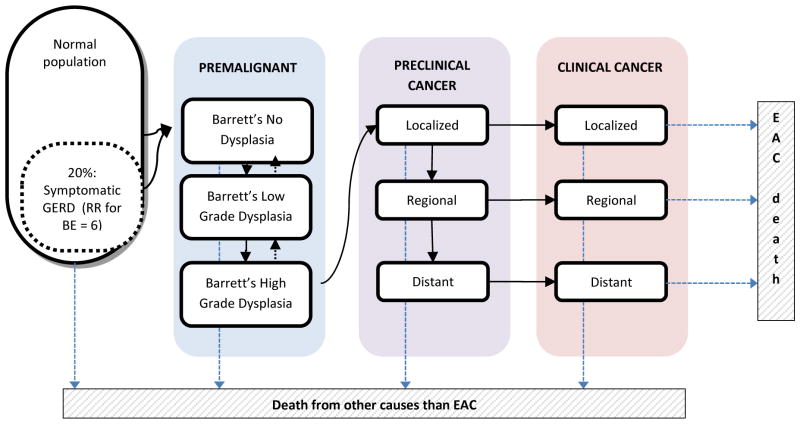
Background & aims: Published estimates for the rate of progression from Barrett's esophagus (BE) to esophageal adenocarcinoma (EAC) vary. We used simulation modeling to reconcile published data and more accurately estimate the incidence of EAC among people with BE.
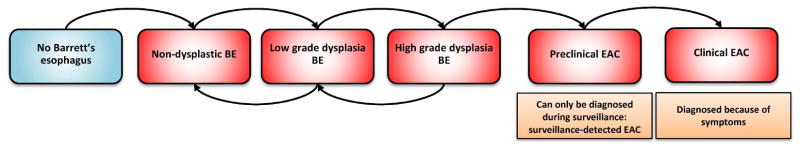
Methods: We calibrated the ERASMUS/UW model (a collaboration between Erasmus Medical Center, Rotterdam, the Netherlands and the University of Washington, Seattle) for EAC to match the 0.18% annual rate of progression from population-based studies. This model was then used to simulate the design of prospective studies, introducing more endoscopic surveillance. We used the model to predict rates of progression for both types of studies and for different periods of follow-up, and compared the predicted rates with published data.
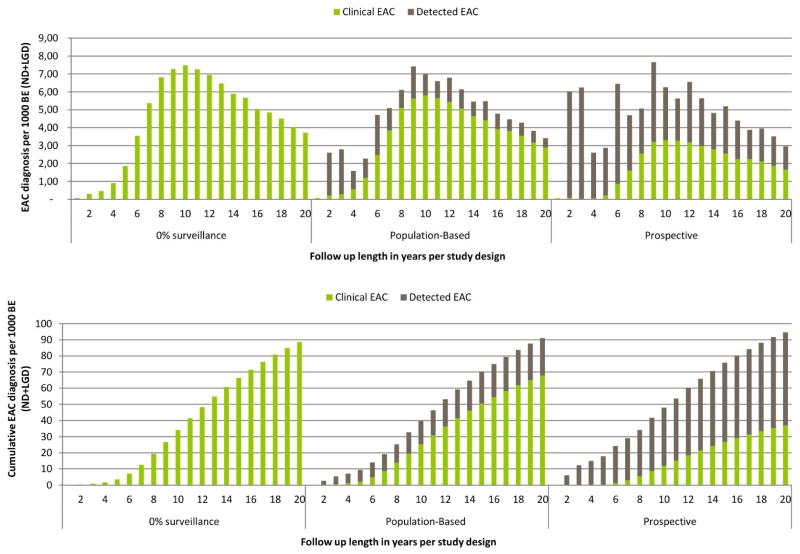
Results: For the first 5 years of follow-up, the model reproduced the 0.19% mean annual rate of progression observed in population-based studies; the same disease model predicted a 0.36% annual rate of progression in studies with a prospective design (0.41% reported in published articles). After 20 years, these rates each increased to 0.63% to 0.65% annually, corresponding with a 9.1% to 9.5% cumulative cancer incidence. Between these periods, the difference between the progression rates of both study designs decreased from 91% to 5%.
Conclusions: In the first 5 years after diagnosis, the rate of progression from BE to EAC is likely to more closely approximate the lower estimates reported from population-based studies than the higher estimates reported from prospective studies in which EAC is detected by surveillance. Clinicians should use this information to explain to patients their short-term and long-term risks if no action is taken, and then discuss the risks and benefits of surveillance.
Keywords: Early Detection; Esophageal Cancer; Microsimulation; Population-Based Modeling.
Copyright © 2015 AGA Institute. Published by Elsevier Inc. All rights reserved.
Figures


References
-
- Gilbert EW, Luna RA, Harrison VL, et al. Barrett’s esophagus: a review of the literature. J Gastrointest Surg. 2011;15:708–18. - PubMed
-
- Yousef F, Cardwell C, Cantwell MM, et al. The incidence of esophageal cancer and high-grade dysplasia in Barrett’s esophagus: a systematic review and meta-analysis. Am J Epidemiol. 2008;168:237–49. - PubMed
-
- Desai TK, Krishnan K, Samala N, et al. The incidence of oesophageal adenocarcinoma in non-dysplastic Barrett’s oesophagus: a meta-analysis. Gut. 2012;61:970–6. - PubMed
-
- Shaheen NJ, Crosby MA, Bozymski EM, et al. Is there publication bias in the reporting of cancer risk in Barrett’s esophagus? Gastroenterology. 2000;119:333–8. - PubMed
Publication types
MeSH terms
Supplementary concepts
Grants and funding
LinkOut - more resources
Full Text Sources
Other Literature Sources
Medical
