. 2015 Jul;36(1):53-64.
doi: 10.3892/ijmm.2015.2199. Epub 2015 Apr 28.

Sulforaphane prevents doxorubicin-induced oxidative stress and cell death in rat H9c2 cells

Affiliations

Sulforaphane prevents doxorubicin-induced oxidative stress and cell death in rat H9c2 cells

Bo Li et al. Int J Mol Med. 2015 Jul.

Abstract

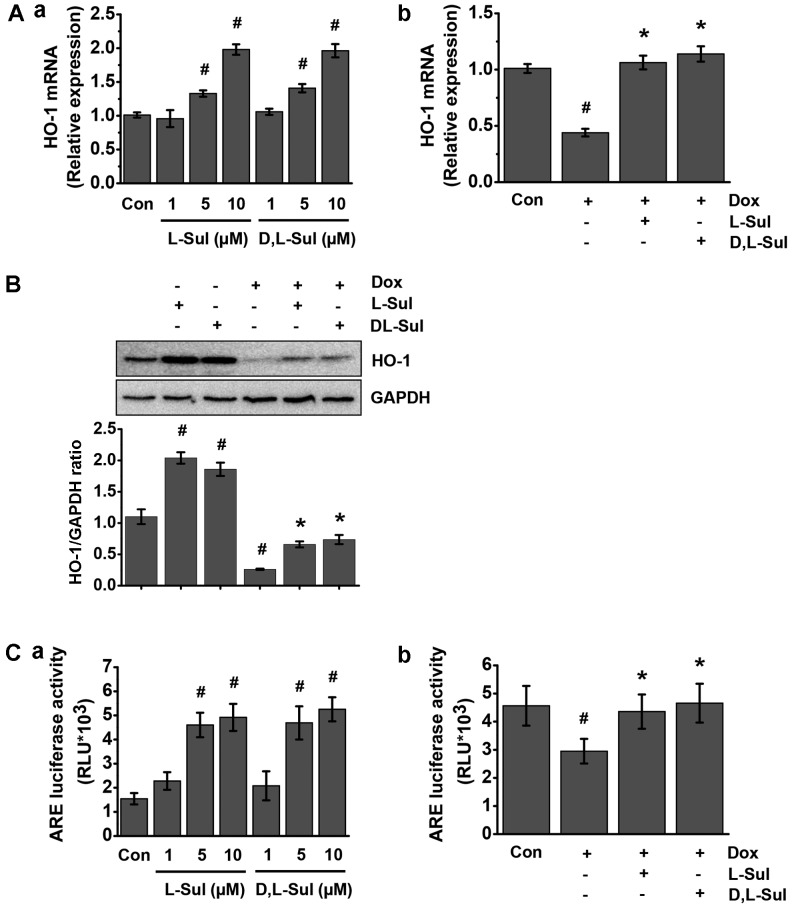
Sulforaphane, a natural isothiocyanate compound found in cruciferous vegetables, has been shown to exert cardioprotective effects during ischemic heart injury. However, the effects of sulforaphane on cardiotoxicity induced by doxorubicin are unknown. Thus, in the present study, H9c2 rat myoblasts were pre-treated with sulforaphane and its effects on cardiotoxicity were then examined. The results revealed that the pre-treatment of H9c2 rat myoblasts with sulforaphane decreased the apoptotic cell number (as shown by trypan blue exclusion assay) and the expression of pro-apoptotic proteins (Bax, caspase-3 and cytochrome c; as shown by western blot analysis and immunostaining), as well as the doxorubicin-induced increase in mitochondrial membrane potential (measured by JC-1 assay). Furthermore, sulforaphane increased the mRNA and protein expression of heme oxygenase-1 (HO-1, measured by RT-qPCR), which consequently reduced the levels of reactive oxygen species (ROS, measured using MitoSOX Red reagent) in the mitochondria which were induced by doxorubicin. The cardioprotective effects of sulforaphane were found to be mediated by the activation of the Kelch-like ECH-associated protein 1 (Keap1)/NF-E2-related factor-2 (Nrf2)/antioxidant-responsive element (ARE) pathway, which in turn mediates the induction of HO-1. Taken together, the findings of this study demonstrate that sulforaphane prevents doxorubicin-induced oxidative stress and cell death in H9c2 cells through the induction of HO-1 expression.


Figures

Figure 1
Figure 1
L-sulforaphane (L-Sul) and D,L-sulforaphane (D,L-Sul) protect against doxorubicin (Dox)-induced cell death. (A) H9c2 cells were stimulated with 1 µM Dox or pre-treated with 10 µM L-Sul or D,L-Sul for 2 h and then treated with 1 µM Dox for 24 h. The effects of L-Sul or D,L-Sul on Dox-induced cell death and morphological alterations in the H9c2 cells were observed under a light microscope. (B) Determination of H9c2 cell viability by trypan blue exclusion assay. #P<0.05 vs. controls; *P<0.05 vs. Dox-treated group. (C) Morphological apoptosis was determined by Hoechst 33258 staining under a fluorescence microscope (left panel). Bar graph showing the quantification of apoptotic cells as a percentage of total cells (right panel). White sqaure boxes indicate apoptotic cells. #P<0.05 vs. controls; *P<0.05 vs. Dox-treated group.
Figure 2
Figure 2
L-sulforaphane (L-Sul) and D,L-sulforaphane (D,L-Sul) prevent the doxorubicin (Dox)-induced release of cytochrome c and Bax activation. (A) H9c2 cells were treated with 1 µM Dox for the indicated periods of time. Cells were processed into cytosolic and mitochondrial fractions and subjected to western blot analysis of Bax and cytochrome c (upper panel). The lower panel shows the results of densitometric analysis. *P<0.05 vs. controls. (B) H9c2 cells were pre-treated with 10 µM L-Sul or D,L-Sul for 2 h, and then treated with 1 µM Dox for 24 h. Cells were then processed into cytosolic and mitochondrial fractions and subjected to western blot analysis of Bax and cytochrome c (upper panel). The lower panel shows the results of densitometric analysis. #P<0.05 vs. controls; *P<0.05 vs. Dox-treated group (C) H9c2 cells were stimulated with 1 µM Dox or pre-treated with 10 µM L-Sul or D,L-Sul for 2 h, and then treated with 1 µM Dox for 24 h. Cells were double-immunostained for Bax and cytochrome c and the nuclei were visualized by DAPI staining. Cyto. c, cytochrome c.
Figure 3
Figure 3
L-sulforaphane (L-Sul) and D,L-sulforaphane (D,L-Sul) prevent the doxorubicin (Dox)-induced activation of caspase-3 and protect against Dox-induced changes in mitochondrial transmembrane potential. (A) H9c2 cells were treated with 1 µM Dox for the indicated periods of time. Cells were lysed and examined for the levels of cleaved caspase-3 by western blot analysis (upper panel). The relative cleaved caspase-3 protein level was normalized to the β-actin level (lower panel). *P<0.05 and **P<0.001 vs. controls. (B) H9c2 cells were pre-treated with 10 µM L-Sul or D,L-Sul for 2 h, and then treated with 1 µM Dox for 24 h. Cells were lysed and examined for the levels of cleaved caspase-3 by western blot analysis (upper panel). Relative cleaved caspase-3 protein levels were normalized to β-actin level (lower panel). #P<0.05 vs. controls; *P<0.05 vs. Dox-treated group. (C) H9c2 cells were stimulated with 1 µM Dox or pre-treated with 10 µM L-Sul or D,L-Sul for 2 h, and then treated with 1 µM Dox for 24 h. Mitochondrial membrane potential was detected by JC-1 fluorescence staining. Specifically, the cells were stained with JC-1 and examined under a fluorescence microscope for the detection of red JC-1 aggregates (590 nm emission) or green JC-1 monomers (527 nm emission). Typical images are shown at ×600 magnification. (D) Quantification of data in (C). #P<0.05 vs. controls; *P<0.05 vs. Dox-treated group.
Figure 4
Figure 4
L-sulforaphane (L-Sul) and D,L-sulforaphane (D,L-Sul) reduce the doxorubicin (Dox)-induced generation of mitochondrial reactive oxygen species (ROS) in H9c2 cells. (A) H9c2 cells were treated with 1 µM doxorubicin or pre-treated with 10 µM L-Sul or D,L-Sul for 2 h, and then treated with 1 µM Dox for 24 h. Cells were then analyzed for mitochondrial superoxide generation by fluorescence microscopy using MitoSOX Red. Representative micrographs are shown on the left panel, and quantification plots are shown on the right panel. Results were calculated as a percentage of control in fluorescence intensity compared with the control group. Plots are the means ± SE (n=3). #P<0.05 vs. controls; *P<0.05 vs. Dox-treated group. (B) H9c2 cells were treated with 1 µM Dox or pre-treated with 10 µM L-Sul or D,L-Sul for 2 h, and then treated with 1 µM Dox for 24 h. Cells were then analyzed for mitochondrial peroxynitrite generation by fluorescence microscopy using DHR123. Representative micrographs are shown on the left panel, and quantification plots are shown on the right panel. Results are calculated as a percentage of control in fluorescence intensity compared with the control group. Plots are the means ± SE (n=3). #P<0.05 vs. controls; *P<0.05 vs. Dox-treated group.
Figure 5
Figure 5
L-sulforaphane (L-Sul) and D,L-sulforaphane (D,L-Sul) activate heme oxygenase-1 (HO-1) through antioxidant-responsive elements (AREs) in H9c2 cells. (A. panel a) H9c2 cells were treated with 10 µM L-Sul or D,L-Sul for 24 h. (Panel b) H9c2 cells were treated with 1 µM doxorubicin (Dox) or pre-treated with 10 µM L-Sul or D,L-Sul for 2 h, and then treated with 1 µM Dox for 24 h. HO-1 mRNA levels were measured by RT-qPCR. #P<0.05 vs. controls; *P<0.05 vs. Dox-treated group. (B) Protein expression of HO-1 and glyceraldehyde 3-phosphate dehydrogenase (GAPDH) was measured by western blot analysis. Densitometric analysis is shown on the lower panel. #P<0.05 vs. controls; *P<0.05 vs. Dox-treated. (C, panel a) H9c2 cells were treated with 10 µM L-Sul or D,L-Sul for 24 h. (Panel b) H9c2 cells were treated with 1 µM Dox or pre-treated with 10 µM L-Sul or D,L-Sul for 2 h, and then treated with 1 µM Dox for 24 h. ARE luciferase activity was measured. #P<0.05 vs. controls; *P<0.05 vs. Dox-treated group.
Figure 6
Figure 6
Activation of the Kelch-like ECH-associated protein 1 (Keap1)/NF-E2-related factor-2 (Nrf2) pathway by L-sulforaphane (L-Sul) and D,L-sulforaphane (D,L-Sul) in H9c2 cells. (A) H9c2 cells were treated with 1 µM doxorubicin (Dox) or pre-treated with 10 µM L-Sul or D,L-Sul for 2 h, and then treated with 1 µM Dox for 24 h. Cells were double immunostained for Nrf2 and Keap1 and nuclei were visualized by DAPI staining. (B) H9c2 cells were treated with 1 µM Dox or pre-treated with 10 µM L-Sul or D,L-Sul for 2 h, and then treated with 1 µM Dox for 24 h. In parallel, cells were also treated with 10 µM L-Sul or D,L-Sul alone for 24 h. Nuclear and cytosolic fractions of H9c2 cells were obtained and subjected to western blot analysis using Nrf2 and Keap1 antibodies (top panel). Glyceraldehyde 3-phosphate dehydrogenase (GAPDH) was used as a cytosolic marker, while histone H3 was used to identify nuclear fractions. Densitometric analysis is shown on the lower panel. #P<0.05 vs. controls; *P<0.05 vs. Dox-treated group.

References

    1. Vilaseca J, Guardia J, Bacardi R, Monné J. Doxorubicin for liver cancer. Lancet. 1978;1:1367. doi: 10.1016/S0140-6736(78)92448-0. - DOI - PubMed
    1. Arcamone F, Cassinelli G, Fantini G, Grein A, Orezzi P, Pol C, Spalla C. Adriamycin, 14-hydroxydaunomycin, a new antitumor antibiotic from S. peucetius var. caesius. Biotechnol Bioeng. 1969;11:1101–1110. doi: 10.1002/bit.260110607. - DOI - PubMed
    1. Hortobágyi GN. Anthracyclines in the treatment of cancer. An overview. Drugs. 1997;54(Suppl 4):S1–S7. - PubMed
    1. Gewirtz DA. A critical evaluation of the mechanisms of action proposed for the antitumor effects of the anthracycline antibiotics adriamycin and daunorubicin. Biochem Pharmacol. 1999;57:727–741. doi: 10.1016/S0006-2952(98)00307-4. - DOI - PubMed
    1. Muggia FM. Clinical efficacy and prospects for use of pegylated liposomal doxorubicin in the treatment of ovarian and breast cancers. Drugs. 1997;54(Suppl 4):S22–S29. doi: 10.2165/00003495-199700544-00006. - DOI - PubMed

Publication types

MeSH terms