

A Validated Prediction Model for Overall Survival From Stage III Non-Small Cell Lung Cancer: Toward Survival Prediction for Individual Patients
- PMID: 25936599
- PMCID: PMC4786012
- DOI: 10.1016/j.ijrobp.2015.02.048
A Validated Prediction Model for Overall Survival From Stage III Non-Small Cell Lung Cancer: Toward Survival Prediction for Individual Patients
Abstract
Purpose: Although patients with stage III non-small cell lung cancer (NSCLC) are homogeneous according to the TNM staging system, they form a heterogeneous group, which is reflected in the survival outcome. The increasing amount of information for an individual patient and the growing number of treatment options facilitate personalized treatment, but they also complicate treatment decision making. Decision support systems (DSS), which provide individualized prognostic information, can overcome this but are currently lacking. A DSS for stage III NSCLC requires the development and integration of multiple models. The current study takes the first step in this process by developing and validating a model that can provide physicians with a survival probability for an individual NSCLC patient.
Methods and materials: Data from 548 patients with stage III NSCLC were available to enable the development of a prediction model, using stratified Cox regression. Variables were selected by using a bootstrap procedure. Performance of the model was expressed as the c statistic, assessed internally and on 2 external data sets (n=174 and n=130).
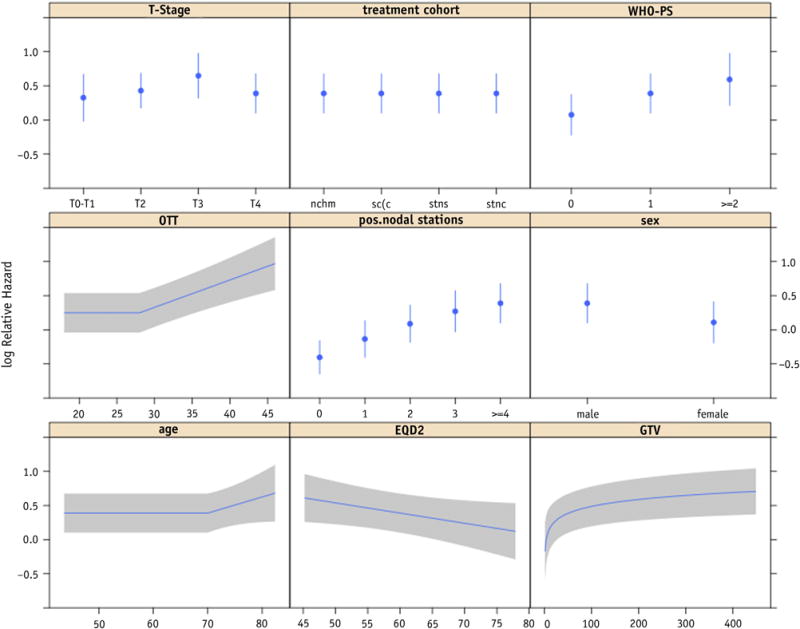
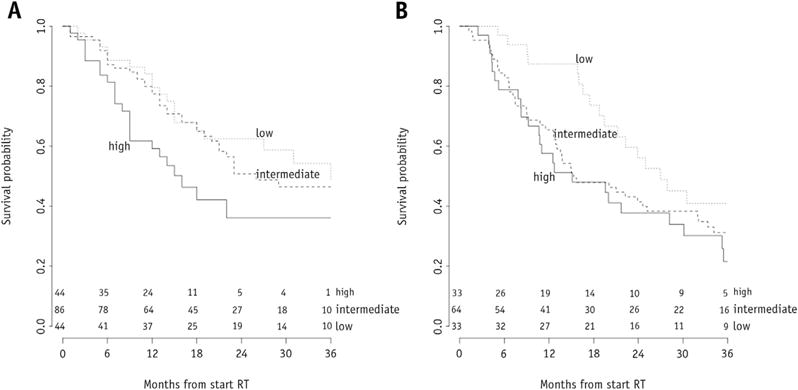
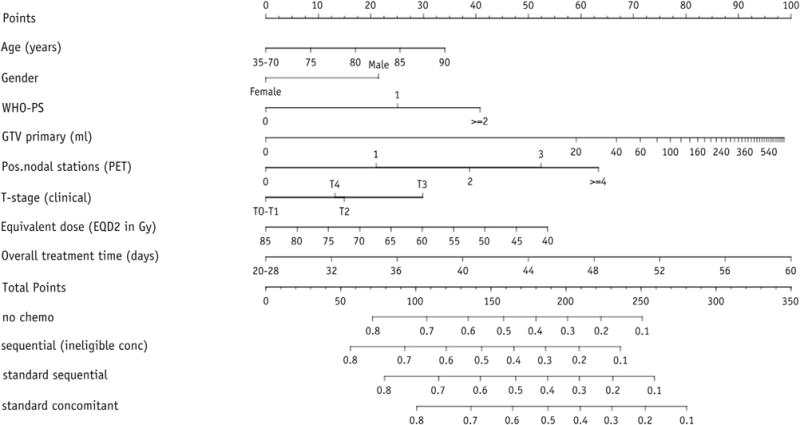
Results: The final multivariate model, stratified for treatment, consisted of age, gender, World Health Organization performance status, overall treatment time, equivalent radiation dose, number of positive lymph node stations, and gross tumor volume. The bootstrapped c statistic was 0.62. The model could identify risk groups in external data sets. Nomograms were constructed to predict an individual patient's survival probability (www.predictcancer.org). The data set can be downloaded at https://www.cancerdata.org/10.1016/j.ijrobp.2015.02.048.
Conclusions: The prediction model for overall survival of patients with stage III NSCLC highlights the importance of combining patient, clinical, and treatment variables. Nomograms were developed and validated. This tool could be used as a first building block for a decision support system.
Copyright © 2015 The Authors. Published by Elsevier Inc. All rights reserved.
Conflict of interest statement
Conflict of interest: none.
Figures
References
-
- Ferlay J, Steliarova-Foucher E, Lortet-Tieulent J, et al. Cancer incidence and mortality patterns in Europe: Estimates for 40 countries in 2012. Eur J Cancer. 2013;49:1374–1403. - PubMed
-
- Siegel R, Ma J, Zou Z, et al. Cancer statistics, 2014. CA Cancer J Clin. 2014;64:9–29. - PubMed
-
- Vansteenkiste J, De Ruysscher D, Eberhardt WE, et al. Early and locally advanced non-small-cell lung cancer (NSCLC): ESMO Clinical Practice Guidelines for diagnosis, treatment and follow-up. Ann Oncol. 2013;24(Suppl 6):vi89–vi98. - PubMed
Publication types
MeSH terms
Substances
Grants and funding
LinkOut - more resources
Full Text Sources
Other Literature Sources
Medical
