. 2015 Aug;12(2):2598-606.
doi: 10.3892/mmr.2015.3702. Epub 2015 Apr 29.

A cortical astrocyte subpopulation inhibits axon growth in vitro and in vivo

Affiliations

A cortical astrocyte subpopulation inhibits axon growth in vitro and in vivo

Rui Liu et al. Mol Med Rep. 2015 Aug.

Abstract

Astrocytes are the most heterogeneous and predominant glial cell type in the central nervous system. However, the functional significance of this heterogeneity remains to be elucidated. Following injury, damaged astrocytes inhibit axonal regeneration in vivo and in vitro. Cultured primary astrocytes are commonly considered good supportive substrates for neuron attachment and axon regeneration. However, it is not known whether different populations of cells in the heterogeneous astrocyte culture affect neuron behavior in the same way. In the present study, the effect of astrocyte heterogeneity on neuronal attachment and neurite outgrowth was examined using an in vitro and in vivo coculture system. In vitro, neonatal cortical astrocytes were co-cultured with purified dorsal root ganglia (DRG) neurons and astrocyte growth morphology, neuron attachment and neurite growth were evaluated. The results demonstrated that the heterogeneous astrocyte cells showed two different types of growth pattern, typical and atypical. Typical astrocytes were supportive to neuron attachment and neurite growth, which was consistent with previous studies, whereas atypical astrocytes inhibited neuron attachment and neurite growth. These inhibitory astrocytes exhibited a special growth pattern with various shapes and sizes, a high cell density, few oligodendrocytes on the top layer and occupied a smaller growth area compared with typical astrocytes. Neurites extended freely on typical supportive astrocyte populations, however, moved away when they reached atypical astrocyte growth pattern. Neurons growing on the atypical astrocyte pattern demonstrated minimal neurite outgrowth and these neurites had a dystrophic appearance, however, neuronal survival was unaffected. Immunocytochemistry studies demonstrated that these atypical inhibitory astrocytes were glial fibrillary acidic protein (GFAP) positive cells. The existence of inhibitory astrocyte subpopulations in normal astrocytes reflects the complexity of the function of astrocyte populations. In vivo, DRG neurons in grey matter did not show neurite growth, while DRG neurons survived and showed robust axon outgrowth along the corpus callosum. In conclusion, further studies on this new type of inhibitory astrocyte subpopulation may deepen our understanding of the complex biology of astrocytes.


Figures

Figure 1
Figure 1
Different cortical glial cell growth patterns coexist in the same culture. (A) Typical growth pattern with two cell layers. Arrows indicate the small dark, process-bearing top layer cells and stars indicate the light, flat, fibroblast-like bed layer cells. (B) Atypical pattern. The star indicates a round cobblestone-like high compact atypical growth pattern and arrowheads indicate the boundary between the typical and atypical pattern. The arrow indicates one dorsal root ganglia neuron with an extending axon. (C and D) Atypical pattern. The star indicates an irregular high density atypical pattern and arrowheads indicate the boundary between atypical and typical growth patterns. (D) White arrowheads indicate the small dark cells on the typical astrocyte growth pattern, which are absent from the atypical pattern. (E and F) Third atypical pattern. The star indicates the polarized arranged atypical growth pattern. Arrowheads indicate the boundary between the typical and atypical growth patterns. Black arrows indicate the radially oriented astrocytes and white arrowheads indicate the small dark cells on the typical pattern, which are absent from the atypical pattern. Scale bar, 100 µm. All atypical patterns are composed of 100–1,000 clustered cells with a similar morphology.
Figure 2
Figure 2
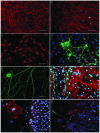
Immunocytochemistry identification of glial cells on typical and atypical growth patterns. (A) GFAP+ glial cells on the typical growth pattern show different shapes and a random arrangement. (B) Local details of one polarized arranged atypical pattern. The star indicates the atypical pattern; white arrows indicate the polarized orientation of GFAP+ cells. (C) Typical pattern top layer O4+ cells showing the morphology of oligodendrocyte precursors. (D) Typical pattern top layer GalC+ cells (green). Red (GFAP+) indicates astrocytes and blue indicates the nuclei of astrocytes. (E) NF+ neurites on the typical growth pattern show a freely extending network around DRG neurons. (F) NF+ neurites (green) extending along the boundary of the typical pattern and polarized arranged atypical pattern (star); white arrows indicate polarized GFAP+ cells (red); arrowheads indicate the neurites avoiding crossing into the atypical pattern. (G) NF+ neurites (green) on the typical pattern extend along the boundary of the cobblestone-like atypical pattern. White arrows indicate neurites and the star indicates the GFAP+ cobblestone-like atypical pattern with a high cell density. (H) NF+ neurites (green) from the typical pattern move away from crossing into the GFAP+ (red) cobblestone-like atypical pattern. White arrows indicate neurite direction changes. Scale bar=50 µm. Red, Alexa Fluor® 594-conjugated secondary antibodies; green, Alexa Fluor® 488-conjugated secondary antibodies; blue, DAPI staining. GFAP, glial fibrillary acidic protein; DRG, dorsal root ganglia; NF, neurofilament; GalC, galactocerebroside.
Figure 3
Figure 3
Quantitative comparison of glial cells in different growth patterns. (A) Astrocyte cell density of the bottom layer in the typical and atypical growth patterns (*P<0.001). (B) Top layer (O4+ and GalC+) cell density in the typical and atypical growth patterns (*P<0.001). (C) Growth area of typical and atypical astrocyte patterns (*P<0.001). Values are presented as the mean ± standard error of the mean of four independent cultures. *P<0.001, as compared with the atypical pattern. Scale bar=100 µm. GalC, galactocerebroside; DAPI, 4′,6-diamidino-2-phenylindole.
Figure 4
Figure 4
Different astrocyte growth patterns affect DRG neuron attachment and neurite growth. (A–C) DRG neurons attached and neurites grew on the typical pattern. (A) The star indicates bottom layer cells, black arrows indicate the DRG neurons and small black arrows indicate the neurite network between DRG neurons. (B and C) The star indicates bottom layer cells, arrowheads indicate DRG neurons and white arrows indicate top small dark cells. (D–K) DRG neurons attached and neurites grew on the atypical pattern. (D) White cross indicates the atypical pattern, the white star indicates the typical pattern and small black arrows indicate the boundary between typical and atypical patterns. Arrowheads indicate DRG neurons at the boundary with dense neurites selectively growing on the typical pattern. The white arrow indicates single neuron attachments on the atypical pattern without axon outgrowth. (E) The white cross indicates a cobblestone atypical pattern, the white star shows the typical pattern and small black arrows indicate neurites extending along the boundary of these two patterns. Arrowheads indicate a DRG neuron on the typical pattern with neurites extending freely. The white arrow shows one single DRG neuron on the atypical pattern without neurite outgrowth. (F) The white arrow indicates three DRG neurons with single thick, short and stiff neurites on the cobblestone-like atypical pattern and the small white arrow indicates the dystrophic endbulb of the neurite. Arrowheads indicate the DRG neurons on the typical growth pattern with branched neurites. (G and H) Neurites grew along the boundary between the typical and polarized atypical pattern. (I) Neurites take shortcut straight pathway to cross over the atypical pattern from the typical pattern. Small white arrows indicate neurites extending along the typical and atypical pattern boundary; black small arrows indicate the neurite shortcut. (J and K) Neurites on the typical pattern altered direction and avoided crossing into the atypical pattern. The white cross indicates the cobblestone-like atypical pattern. The white star indicates the typical pattern; the arrowhead indicates DRG neurons; small black arrows indicate neurites that moved away from crossing into the atypical area and selectively extended on the typical pattern along the boundary between them. (L) Neurite end tips showed dystrophic endbulbs. The white cross indicates the cobblestone-like atypical pattern; the star indicates the typical pattern. The arrowhead indicates a DRG neuron. White small arrows show neurites extending along the boundary of the typical and atypical pattern. Black small arrows indicate dystrophic endbulbs of short, straight neurites crossing into the atypical pattern. (M) DRG neuron attachment on the typical and atypical pattern (*P<0.0001). (N) DRG neurons with neurites on the typical and atypical growth pattern (*P<0.001). (O) DRG neuron with neurite (neurite length >5 cell bodies; *P<0.001). (P) Neurite with dystrophic endbulbs on the typical and atypical pattern (*P<0.001). Values are presented as the mean ± standard error of the mean of four independent cultures. *P<0.001, as compared with the atypical pattern. Scale bar=100 µm. DRG, dorsal root ganglia; NF, neurofilament.
Figure 5
Figure 5
Transplanted DRG neurons show different neurite growth behavior in cortical grey matter and white matter. (A) CGRP+ DRG neurons (red) on cortical grey matter exhibit minimal axon outgrowth. (B) GFAP+ astrocytes (green) grow on cortical grey matter. (C) DRG neurons show minimal axon outgrowth on astrocytes in cortical grey matter. (D) CGRP+ DRG neurons and fibers (red) on cortical white matter exhibit robust axon outgrowth. (E) GFAP+ astrocytes (green) grow on the corpus callosum. (F) DRG neurons show robust axon outgrowth on astrocytes in cortical white matter. Red, Alexa Fluor® 594-conjugated secondary antibodies; green, Alexa Fluor® 488-conjugated secondary antibodies Scale bar=50 µm. (G) Neonatal rat DRG neurons were transplanted into brain grey (cortex) and white matter (corpus callosum) and 3 weeks later, the neurite outgrowth of transplanted DRG neurons was detected using the CGRP antibody. All the transplanted DRG neurons in the corpus callosum demonstrated extensive neurite outgrowth, however, no observable neurite outgrowth was detected in DRG neurons transplanted into grey matter (P<0.0001; t-test). DRG, dorsal root ganglia; GFAP, glial fibrillary acidic protein; CGRP, calcitonin gene related peptide.

Similar articles

Cited by

References

    1. Barres BA. The mystery and magic of glia: A perspective on their roles in health and disease. Neuron. 2008;60:430–440. doi: 10.1016/j.neuron.2008.10.013. - DOI - PubMed
    1. Allen NJ, Barres BA. Neuroscience: Glia - more than just brain glue. Nature. 2009;457:675–677. doi: 10.1038/457675a. - DOI - PubMed
    1. Kimelberg HK. Functions of mature mammalian astrocytes: A current view. Neuroscientist. 2010;16:79–106. doi: 10.1177/1073858409342593. - DOI - PubMed
    1. Kettenmann H, Ransom BR, editors. Neuroglia. 2nd edition. Oxford University Press; New York: 2005. The concept of neuroglia: a historical perpspective; pp. 1–9.
    1. Raff MC, Abney ER, Cohen J, Lindsay R, Noble M. Two types of astrocytes in cultures of developing rat white matter: Differences in morphology, surface gangliosides and growth characteristics. J Neurosci. 1983;3:1289–1300. - PMC - PubMed