. 2015 May 20;86(4):1000-1014.
doi: 10.1016/j.neuron.2015.03.060. Epub 2015 Apr 30.

Injury-induced decline of intrinsic regenerative ability revealed by quantitative proteomics

Affiliations

Injury-induced decline of intrinsic regenerative ability revealed by quantitative proteomics

Stephane Belin et al. Neuron. .

Abstract

Neurons differ in their responses to injury, but the underlying mechanisms remain poorly understood. Using quantitative proteomics, we characterized the injury-triggered response from purified intact and axotomized retinal ganglion cells (RGCs). Subsequent informatics analyses revealed a network of injury-response signaling hubs. In addition to confirming known players, such as mTOR, this also identified new candidates, such as c-myc, NFκB, and Huntingtin. Similar to mTOR, c-myc has been implicated as a key regulator of anabolic metabolism and is downregulated by axotomy. Forced expression of c-myc in RGCs, either before or after injury, promotes dramatic RGC survival and axon regeneration after optic nerve injury. Finally, in contrast to RGCs, neither c-myc nor mTOR was downregulated in injured peripheral sensory neurons. Our studies suggest that c-myc and other injury-responsive pathways are critical to the intrinsic regenerative mechanisms and might represent a novel target for developing neural repair strategies in adults.


Figures

Figure 1
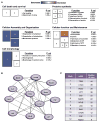
Figure 1. Proteomics analysis of the RGCs before and 3 days after optic nerve crush
(A) Representative FACS plots illustrating the steps of RGC purification. Dissociated retinal cells were gated based on size and surface characteristics (Forward Scatter FSC-A, x axis, Side Scatter SSC-A, y-axis; first graph from left). DAPI positive neurons, staining dead cells depicted in blue, are excluded by sorting (second graph from left). Retinal cells without YFP were used as controls to set up the threshold for YFP+ cells (third graph). The last graph shows the population of YFP+ RGCs that were selected. (B) A schematic of the multiplexed quantitative proteomics workflow. Retinas from uninjured (WT-wild type) and 3 days post optic nerve crush (WTc) YFP17 mice were collected (i). After dissociation, YFP+ neurons were purified by FACS (ii). 3 independent biological replicate samples were collected for each condition (each sample from at least 10 animals), and subjected to cell lysis (iii) and tryptic digestion (iv). Samples were then labeled with specific mass-coded TMT tags (illustrated with different colors), prior to mixture (v), OFFgel fractionation (vi) LC-MS/MS and informatics analyses to identify and quantify peptide spectrum matches (PSMs) (vii–x). (C) Table of the numbers of PSMs (peptide spectrum matches), unique peptides and proteins identified from our analysis. (D) The plot showing the quantitative distribution of the 1409 identified proteins according to their log2 expression ratio (WTc/WT).
Figure 2
Figure 2. Functional annotation and network analysis of injury-altered proteins in RGCs
(A) Protein ontology categories enriched in the proteins affected by injury. IPA analysis indicates the up-regulation (in orange), down-regulation (in blue) or non-predictable (in white) function variation after injury for each cluster. The size of each square is proportional to the number of altered proteins in this functional category. (B) Major hubs from the merged network analysis of injury-altered proteins. Factors and/or pathways of interest are added in this spider-web, based on their targets. (C) Table of major regulators ranked based on their numbers of total interactions (nodes) in the interaction web.
Figure 3
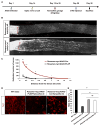
Figure 3. c-myc expression promotes neuronal survival and axon regeneration after optic nerve injury
(A) Timeline of the experimental procedures. (B) c-myc mRNA levels in intact and injured RGCs detected by real time q-PCR. mRNA samples were extracted from purified RGCs isolated from YFP+ retina at 3 days post injury or from intact control retinas. Results are normalized to GAPDH. **: p < 0.01, T-test. Error bars: S.E.M (C) Representative images of retinal sections stained with anti-c-myc (in red), anti-Tuj1 (in green) antibodies, and DAPI (in blue). Scale bar: 20 μm. (D) Scheme of experimental procedures to assess axonal regeneration. (E) Representative confocal images of CTB-labeled optic nerve sections from Rosamer-c-myc mice with intravitreal injection of AAV-PLAP (n = 5) or AAV-Cre (n =7). Red stars indicate the crush site. Scale Bar: 100um. (F) Quantification of the numbers of regenerative axons counted at different distances distal from the lesion. ***: p < 0.001, **: p < 0.01 and *: p < 0.05, T-Test. Error bars: S.E.M (G) Quantification of survived RGCs as detected by anti-Tuj-1 immunostaining in whole mount retinas from intact Rosamer-c-myc mice (n = 5), injured Rosamer-c-myc mice with injection of AAV2-PLAP (n = 5) or AAV2-Cre (n = 5). ***: p < 0.001, ANOVA with Bonferroni post test.
Figure 4
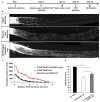
Figure 4. Delayed c-myc expression promotes RGC survival and axon regeneration after optic nerve injury
(A) Timeline for delayed activation of c-myc after the optic nerve injury. (B) Representative confocal images of CTB-labeled optic nerve sections from control (AAV2-PLAP; n= 5) and Rosamer-c-myc (c-Myc) mice (n=7). Scale bar 100μm. (C) Quantification of regenerative axons counted at different distances distal from the lesion. T-Test. ***: p <0.001 and *: p <0.05. (D) Representative images of whole mount retinas, stained with anti-Tuj1, from intact, injured control (AAV2-PLAP; n= 5) and injured c-myc mice (AAV2-Cre, n=7). Scale bar: 20 um. Error bars: S.E.M (E) Quantification of Tuj1+ RGCs in different groups. AI: After Injury. BI: Before Injury. ANOVA with Bonferroni post test. ***: P <0,001.
Figure 5
Figure 5. Synergistic effect of PTEN deletion with c-myc overexpression
(A) Timeline of experimental procedure. (B) Representative confocal images of the optic nerve sections from PTENf/f (infected with AAV2-Cre), Rosamer-myc (infected with AAV2-Cre and treated with Tamoxifen) and PTENf/f mice infected with AAV2-Cre and AAV2-c-myc. Axons are labeled with CTB. Red stars indicate the crush site. Scale bar: 100 μm. (C) Quantification of regenerative axons in the three groups presented in (B). ANOVA with Bonferroni post test. *p<0.05. Error bars: S.E.M. (D) Quantification of RGC survival as measured by Tuj1 staining ANOVA with Bonferroni post test. ***p-value <0,001 and *p<0.05.
Figure 6
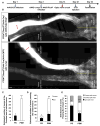
Figure 6. c-myc expression enhances optic nerve regeneration induced by co-deletion of PTEN and SOCS3 in RGCs
(A) Timeline of the experimental procedures. (B) Representative confocal images of CTB-labeled optic nerve whole-mounts from PTENf/f/SOCS3f/f mice with intravitreal injection of AAV2-Cre, AAV2-CNTF and AAV2-c-myc (n=6) or AAV2-Cre, AAV2-CNTF and AAV2-PLAP (n=6). Optic nerve crush was performed on the right optic nerve head and regenerative axons were labeled with CTB-Alexa-555. Red stars indicate the crush site. Scale bar: 100 um. (C, D) Quantification of the numbers of regenerating axon at the proximal end of the chiasm (C) and regenerating axons that passed the chiasm, including those crossing the midline (contra) and navigating ipsilaterally (ipsi) (D). (E) Distribution of regenerating axons projecting in the contralateral optic nerve (gray), the contralateral optic tract (white) and ipsilateral optic tract (black) in the groups of PS (PTENf/f/SOCS3f/f with AAV2-Cre, AAV2-CNTF and AAV2-PLAP) and PSM (PTENf/f/SOCS3f/f with AAV2-Cre, AAV2-CNTF and AAV2-c-myc). T-test, ***: p < 0.001 and *: p < 0.05.
Figure 7
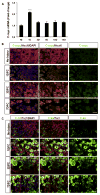
Figure 7. c-myc expression and mTOR activation in injured DRG neurons
(A) The quantification of the c-myc mRNA levels measured by qPCR on the mRNA extracted from intact L4-6 DRGs or those at different time points after sciatic nerve crush. Results are normalized against GAPDH and the level of c-myc expression in intact DRGs was used as references. One day after injury there is an increase in c-myc RNA. ANOVA test ***: p<0.001. (B) DRG sections collected before sciatic nerve crush (no injury), 1, 3, or 7 days post crush (DPC). DRG sections are stained with c-myc (green), NeuN (red) and DAPI (blue). c-myc expression increases after sciatic nerve injury. Scale bar: 50 um. (C) DRG sections from different conditions are stained with Tuj1 (red), anti-phospho-S6 (green) and DAPI (blue). The Phospho-S6 immunoreactivity increases after sciatic nerve injury. Scale bar: 50 um.

References

    1. Bareyre FM, Kerschensteiner M, Raineteau O, Mettenleiter TC, Weinmann O, Schwab ME. The injured spinal cord spontaneously forms a new intraspinal circuit in adult rats. Nat Neurosci. 2004;7:269–277. - PubMed
    1. Blackmore MG, Wang Z, Lerch JK, Motti D, Zhang YP, Shields CB, Lee JK, Goldberg JL, Lemmon VP, Bixby JL. Kruppel-like Factor 7 engineered for transcriptional activation promotes axon regeneration in the adult corticospinal tract. Proc Natl Acad Sci U S A. 2012;109:7517–7522. - PMC - PubMed
    1. Bradke F, Fawcett JW, Spira ME. Assembly of a new growth cone after axotomy: the precursor to axon regeneration. Nat Rev Neurosci. 2012;13:183–193. - PubMed
    1. Cai D, Qiu J, Cao Z, McAtee M, Bregman BS, Filbin MT. Neuronal cyclic AMP controls the developmental loss in ability of axons to regenerate. J Neurosci. 2001;21:4731–4739. - PMC - PubMed
    1. Chen A, Springer JE. Neuroproteomic methods in spinal cord injury. Methods Mol Biol. 2009;566:57–67. - PubMed

Publication types