. 2015 May 20;86(4):923-935.
doi: 10.1016/j.neuron.2015.03.066. Epub 2015 Apr 30.

Spatiotemporal control of opioid signaling and behavior

Affiliations

Spatiotemporal control of opioid signaling and behavior

Edward R Siuda et al. Neuron. .

Abstract

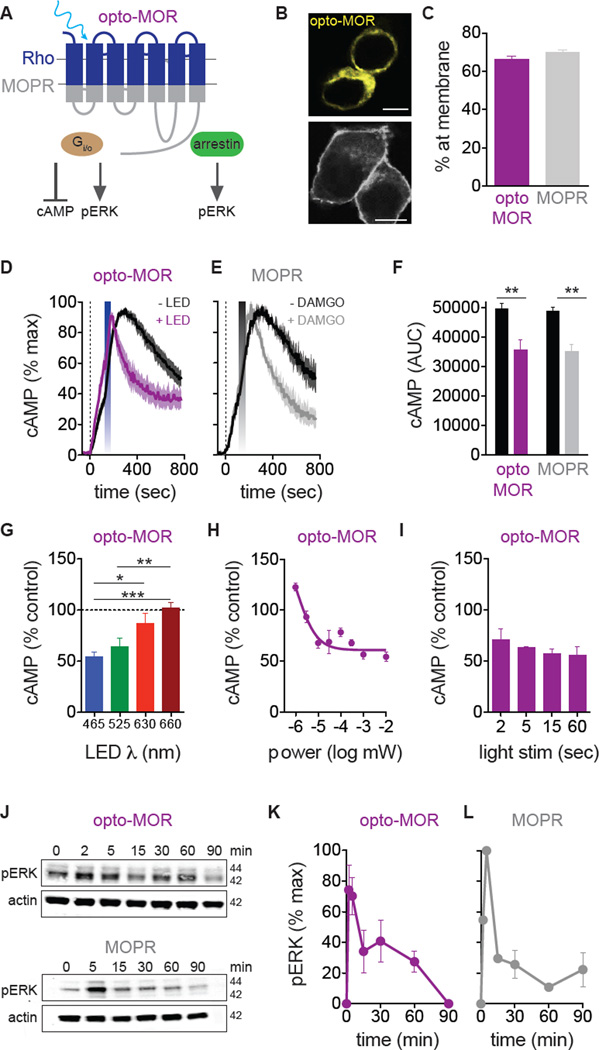
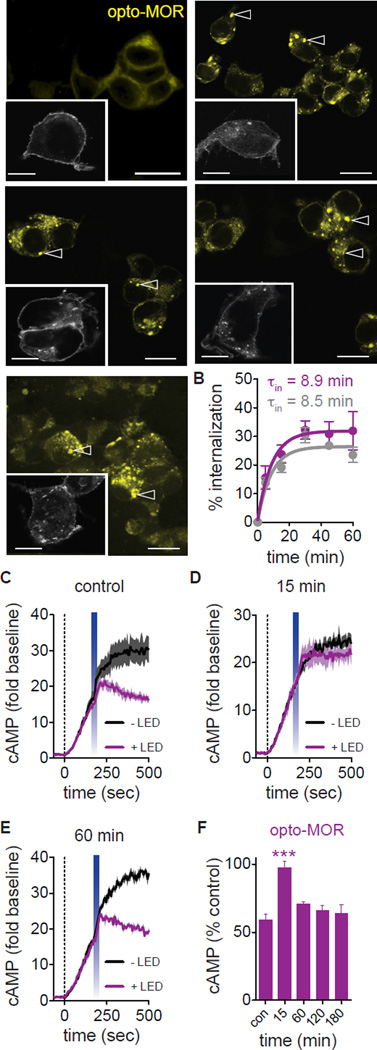
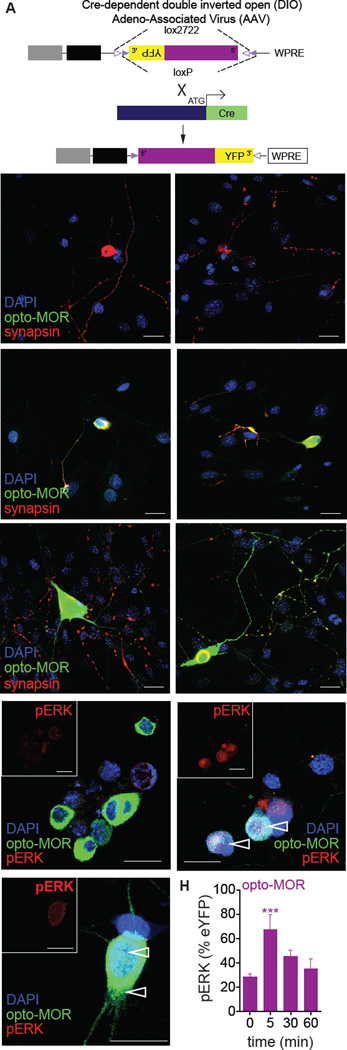
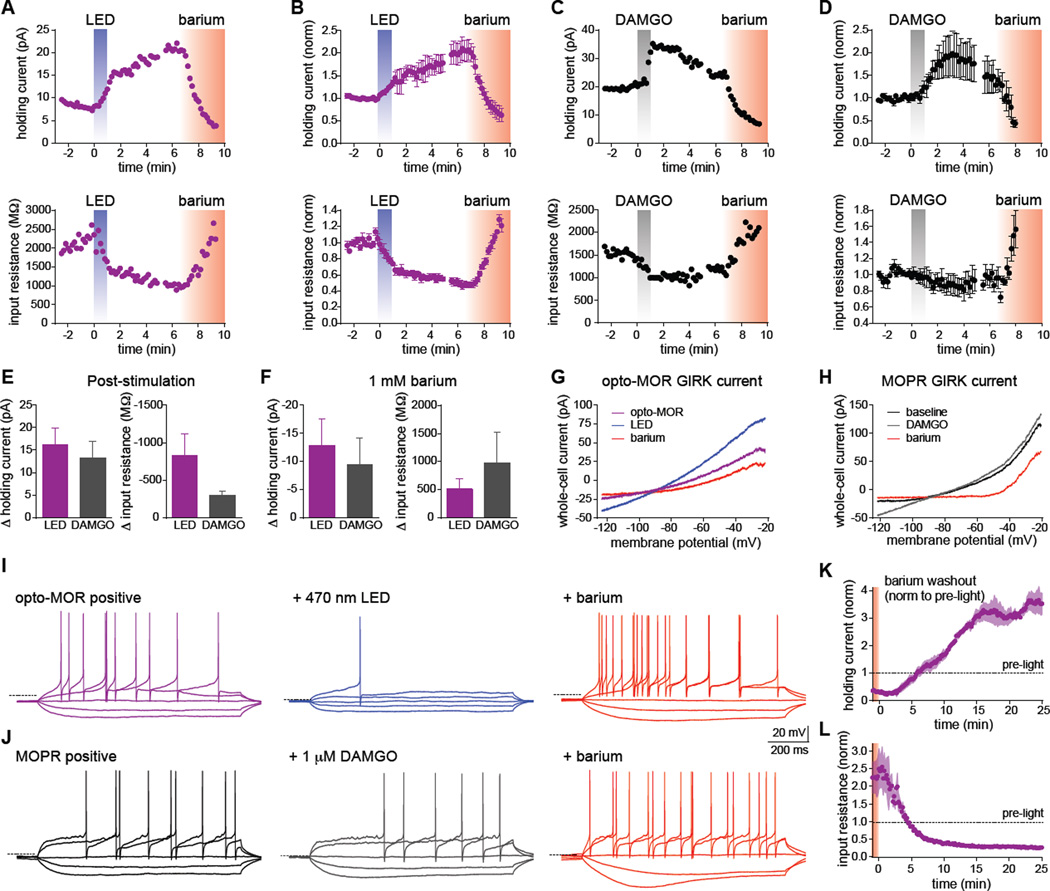
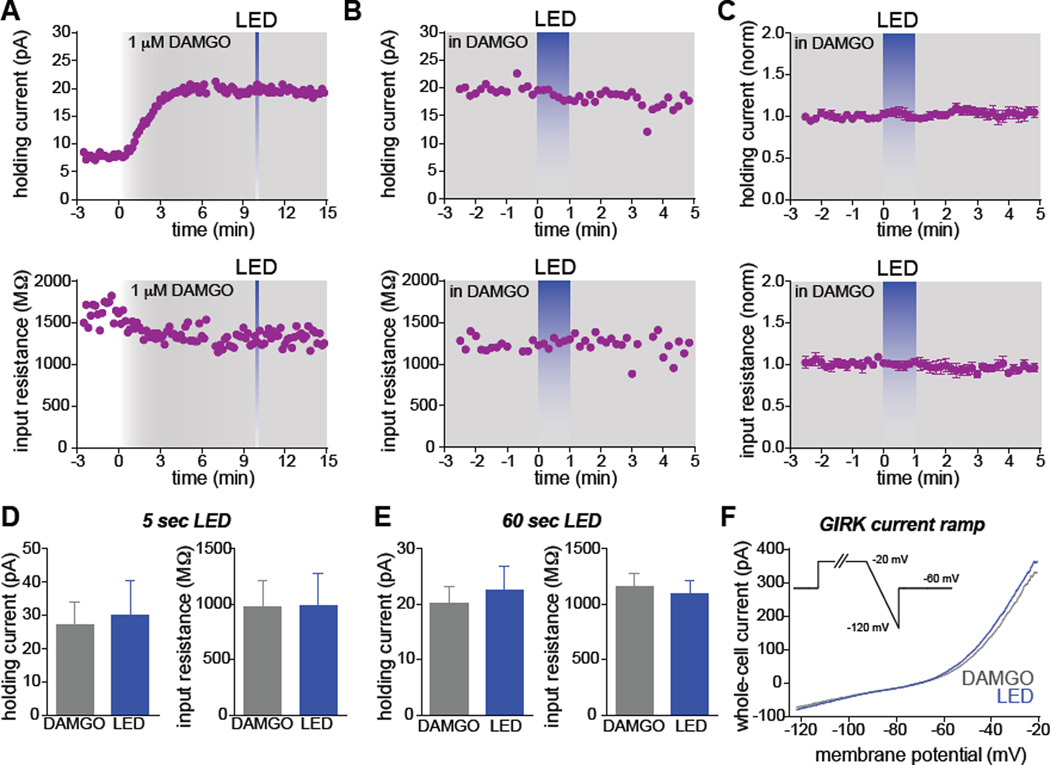
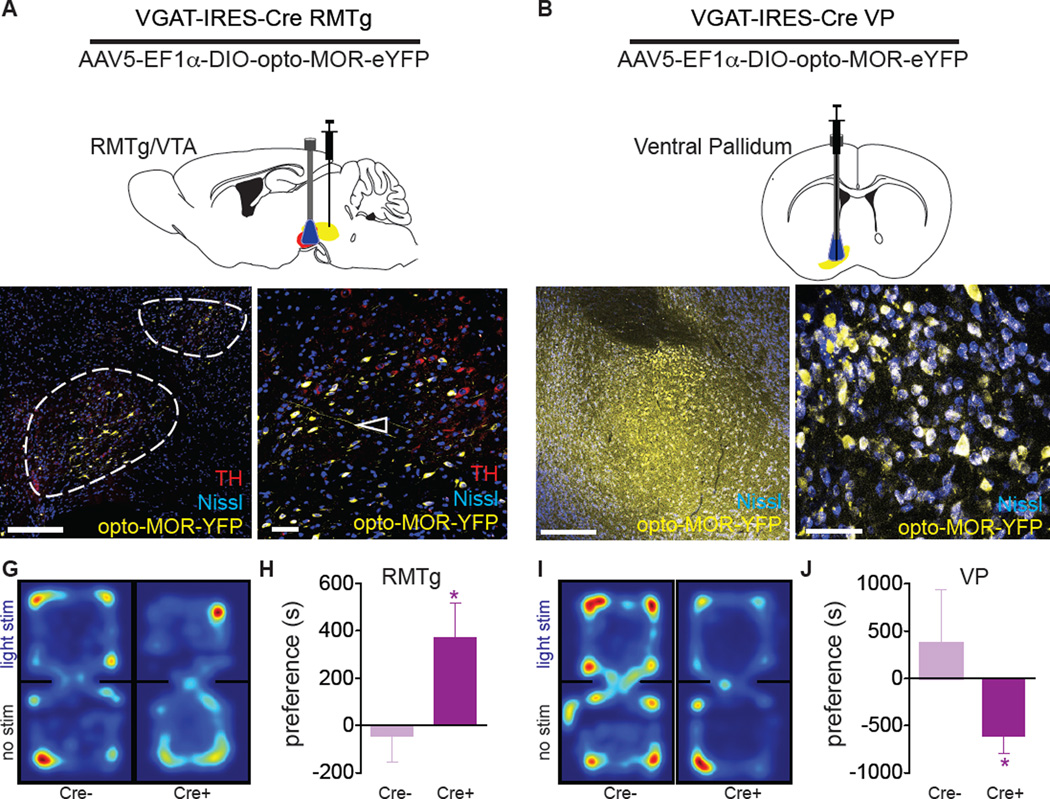
Optogenetics is now a widely accepted tool for spatiotemporal manipulation of neuronal activity. However, a majority of optogenetic approaches use binary on/off control schemes. Here, we extend the optogenetic toolset by developing a neuromodulatory approach using a rationale-based design to generate a Gi-coupled, optically sensitive, mu-opioid-like receptor, which we term opto-MOR. We demonstrate that opto-MOR engages canonical mu-opioid signaling through inhibition of adenylyl cyclase, activation of MAPK and G protein-gated inward rectifying potassium (GIRK) channels and internalizes with kinetics similar to that of the mu-opioid receptor. To assess in vivo utility, we expressed a Cre-dependent viral opto-MOR in RMTg/VTA GABAergic neurons, which led to a real-time place preference. In contrast, expression of opto-MOR in GABAergic neurons of the ventral pallidum hedonic cold spot led to real-time place aversion. This tool has generalizable application for spatiotemporal control of opioid signaling and, furthermore, can be used broadly for mimicking endogenous neuronal inhibition pathways.


Figures

Figure 1
Figure 1. Opto-MOR and MOR share canonical intracellular G-protein signaling mechanisms
(A) Schematic of opto-MOR showing activation of cAMP and pERK pathways. (B) Opto-MOR and MOPR are highly expressed at membrane in HEK293 cells (scale bar = 10 µm). (C) Opto-MOR (purple n = 43 cells) and MOPR (n = 37 cells) share similar surface expression in HEK293 cells. (D) Optical stimulation (blue bar; 20 sec, 1 mW) of opto-MOR reduces forskolin-induced (dashed line) cAMP in HEK cells (n = 9–10 experiments). (E) Application of DAMGO (grey bar; 1 µM) reduces forskolin-induced (dashed line) cAMP in HEK293 cells expressing MOPR (n = 3 experiments). (F) Light and DAMGO significantly reduce forskolin-induced cAMP in opto-MOR (purple; n = 12) and MOPR (grey; n = 3). (G) cAMP inhibition by opto-MOR is most efficient at 465 nm (n = 6–8 experiments; * p < 0.05, ** p < 0.01; *** p < 0.001 via One-Way ANOVA with Bonferroni’s Multiple Comparison Test). (H) cAMP inhibition by opto-MOR is not dependent on light pulse length (n = 2–10 experiments). (I) cAMP inhibition by opto-MOR is power dependent (n = 3–9 experiments). (J) Representative immunoblots show similar kinetic increases in pERK in response to light (1 min, 1 mW) or DAMGO (1 µM) in opto-MOR (purple) and MOPR (grey) expressing cells. (F) Quantification of light-induced pERK in opto-MOR (n = 6) and (L) DAMGO-induced pERK in MOPR (n = 2). Data are represented as mean ± SEM. See also Figures S1 and S2.
Figure 2
Figure 2. Opto-MOR and MOPR internalization and recovery from desensitization
(A) Representative images show internalization of opto-MOR (colorized yellow; scale bar = 50 µm) and MOPR (inset; grey; scale bar = 10 µm) expressed in HEK293 cells in response to light and DAMGO. 0, 5, 15, 30 and 45 min time points represented. Arrowheads show examples of internalized receptor. (B) Quantification of receptor internalization in opto-MOR (purple; τin = 8.9 min; n = 16–43 cells per time point over 2 experimental replicates) and MOPR (grey; τin = 8.5 min; n = 24–38 cells per time point over 3 experimental replicates) in response to light and DAMGO-induced activation respectively. (C) Opto-MOR inhibits forskolin-induced (dashed line) cAMP following light stimulation (n = 4 traces). (D) A second light pulse 15 min following the first shows a loss of opto-MOR activity (n = 3–4 traces). (E) cAMP inhibitory activity returns to baseline levels 60 min following an initial light pulse (n = 3 traces). (F) Time course of recovery from desensitization (n = 3–11 replicates; *** p < 0.001 via One Way ANOVA followed by Dunnett’s Multiple Comparison Test to control). Data are represented as mean ± SEM. See also Figure S2.
Figure 3
Figure 3. Opto-MOR expression and function in DRG neurons
(A) Opto-MOR packaged into an AAV5-DIO, EF1α-YFP viral construct. Cre expression is driven from the sensory neuron-specific Advillin promoter following insertion after the initial start codon, resulting in Cre-mediated recombination and inversion of the opto-MOR construct into the appropriate 5’–3’ orientation. (B) Uninfected DRGs colabeled with the nuclear stain DAPI (blue) and synapsin (red). (C) Opto-MOR expression (green) in DRGs 2 days in vitro (DIV). Large arrowheads point to the soma of infected neurons. (D) Opto-MOR expression (green) in DRGs 5 DIV. Small arrowheads highlight opto-MOR expression in synaptic terminals colabeled with synapsin (red). Scale bars for panels B-D = 30 µm. (E) Unstimulated opto-MOR expressed in DRGs after 5 DIV labeled with pERK (red; and inset). (F) Opto-MOR expressing DRGs (5 DIV) 5 min following photostimulation and labeled for pERK (red; and inset). Open arrows denote internalized punctate receptors. (G) Higher magnification of opto-MOR expressing DRGs (5 DIV) 5 min following photostimulation and labeled for pERK (red; and inset). Open arrows denote internalized punctate receptors. (H) pERK intensity normalized to opto-MOR-YFP intensity at varying times following photostimulation (n = 3–32 DRG neurons per time point; *** p < 0.001 via One Way ANOVA followed by Dunnett’s Multiple Comparison Test to 0 min. Scale bars for panels E-G = 20 µm. Data are represented as mean ± SEM.
Figure 4
Figure 4. Photostimulation of opto-MOR and activation of endogenous MOPRs have similar effects on neuronal physiology and excitability in GABAergic PAG neurons
(A) Representative plots from an opto-MOR+ neuron in acute PAG slices illuminated with 470 nm LED light (10 mW/mm2) for 60s. The top trace shows a rapid outward current in response to illumination, while the bottom trace depicts the simultaneous drop in input resistance. Bath application of 1 mM barium (red shading) blocked both the outward current and reversed the change in input resistance. (B) Normalized summary plots showing the response to LED stimulation from additional opto-MOR+ neurons as described in panel A (n=4). (C) Example traces recorded from a MOPR+ neuron stimulated with 1 µM DAMGO (grey bars) showing similar outward currents (top) and decreased input resistance (bottom) compared to opto-MOR+ neurons shown in panels A and B. (D) Normalized summary plots from additional MOPR+ neurons depicting the response to DAMGO as described in panel C (n=4). (E) Quantification of the peak changes in holding current and input resistance following LED (purple) or DAMGO (gray) stimulation (n=4). (F) Quantification of the peak changes in holding current and input resistance after application of 1 mM barium (n=4). (G–H) Representative current-voltage traces from a 250 ms voltage ramp from −20 to −120 mV, in an opto-MOR+ neuron before (purple trace) and after 60s LED stimulation (blue), or a MOPR+ neuron before (black) or after stimulation with 1 µM DAMGO (gray). Both currents were reduced by the GIRK channel blocker barium (1 mM, red). (I–J) Left traces depict voltage traces from current-clamp recordings of an opto-MOR+ (purple traces) or MOPR+ neuron (black) in response to hyperpolarizing current injections of −20 and −10 pA, and depolarizing current injections of 1- and 2-times rheobase. Middle traces show decreased input resistance and excitability following LED (blue) and DAMGO (gray), in response to the same current injections before stimulation. The right traces demonstrate the increased input resistance and neuronal excitability observed following GIRK channel block with 1 mM barium (red). Dashed lines indicate −60 mV membrane potential. (K–L) Normalized summary plots of the persistent outward current (K) and decreased input resistance (L) in opto-MOR+ neurons following light stimulation and subsequent barium washout (n=3). These effects were observed >45 min after 60s LED stimulation. The dashed lines indicate the average response before illumination. Data are represented as mean ± SEM. See also Figure S4.
Figure 5
Figure 5. Activation of endogenous mu opioid receptors occludes GIRK channel activation by opto-MORs
(A) Example plots from an opto-MOR and MOPR+ GABAergic neuron in the PAG. An outward current and simultaneous decrease in input resistance were observed following prolonged application of 1 µM DAMGO, which plateaued after ~5 min. Brief (5s) LED illumination did not result in further changes to either of these parameters. (B) Example plots from a different neuron positive for both opto-MOR and MOPR in the presence of 1 µM DAMGO. The plateaued response to DAMGO is not shown in this example. Prolonged LED illumination (blue, 60s) did not alter the holding current or input resistance. (C) Normalized summary graph showing the occluded responses to LED illumination following stimulation of endogenous MOPRs with DAMGO (n=3). (D) Quantification of the holding current and input resistance in the presence of DAMGO and following 5s of LED stimulation (n=3). (E) Same quantification as in panel D, but with 60s illumination (n=3). (F) Representative GIRK channel ramp in the presence of DAMGO and following LED stimulation. Data are represented as mean ± SEM.
Figure 6
Figure 6. Photostimulation of opto-MOR causes MOR-like behavioral profiles in vivo
(A) Mice with AAV5-DIO-opto-MOR-YFP injected into the RMTg (yellow) with a fiber optic implanted into the VTA (red) and (B) the ventral pallidum. (C,D) Viral expression in fibers (open arrows) projecting into the VTA (identified by tyrosine hydroxylase staining in red) as well as GABAergic interneurons of the VTA (closed arrows). (E,F) Viral expression in VP GABA neurons (open arrows). Mice expressing opto-MOR in the RMTg-VTA (n=8) display significantly increased real-time preference behavior compared to controls (Cre- littermates, n=7) as shown by representative position heat maps (G) and the mean preference for the stimulation-paired chamber (H). (I) Mice injected into the VP (n=16) display the converse aversion behavior in the place preference assay compared to controls (Cre- littermate controls, n=5) spending less time in the light stimulated chamber also shown by position heat maps (I) and mean place preference results (J). *p<0.05 via unpaired t-test. Data are represented as mean ± SEM. See also Figure S5.

Comment in

References

    1. Airan RD, Thompson KR, Fenno LE, Bernstein H, Deisseroth K. Temporally precise in vivo control of intracellular signalling. Nature. 2009;458:1025–1029. - PubMed
    1. Atasoy D, Aponte Y, Su HH, Sternson SM. A FLEX switch targets Channelrhodopsin-2 to multiple cell types for imaging and long-range circuit mapping. J. Neurosci. Off. J. Soc. Neurosci. 2008;28:7025–7030. - PMC - PubMed
    1. Banghart MR, Sabatini BL. Photoactivatable neuropeptides for spatiotemporally precise delivery of opioids in neural tissue. Neuron. 2012;73:249–259. - PMC - PubMed
    1. Barish PA, Xu Y, Li J, Sun J, Jarajapu YPR, Ogle WO. Design and functional evaluation of an optically active µ-opioid receptor. Eur. J. Pharmacol. 2013;705:42–48. - PubMed
    1. Belcheva MM, Clark AL, Haas PD, Serna JS, Hahn JW, Kiss A, Coscia CJ. Mu and kappa opioid receptors activate ERK/MAPK via different protein kinase C isoforms and secondary messengers in astrocytes. J. Biol. Chem. 2005;280:27662–27669. - PMC - PubMed

Publication types

MeSH terms