. 2015 May 12;11(6):893-901.
doi: 10.1016/j.celrep.2015.04.014. Epub 2015 Apr 30.

ATM couples replication stress and metabolic reprogramming during cellular senescence

Affiliations

ATM couples replication stress and metabolic reprogramming during cellular senescence

Katherine M Aird et al. Cell Rep. .

Abstract

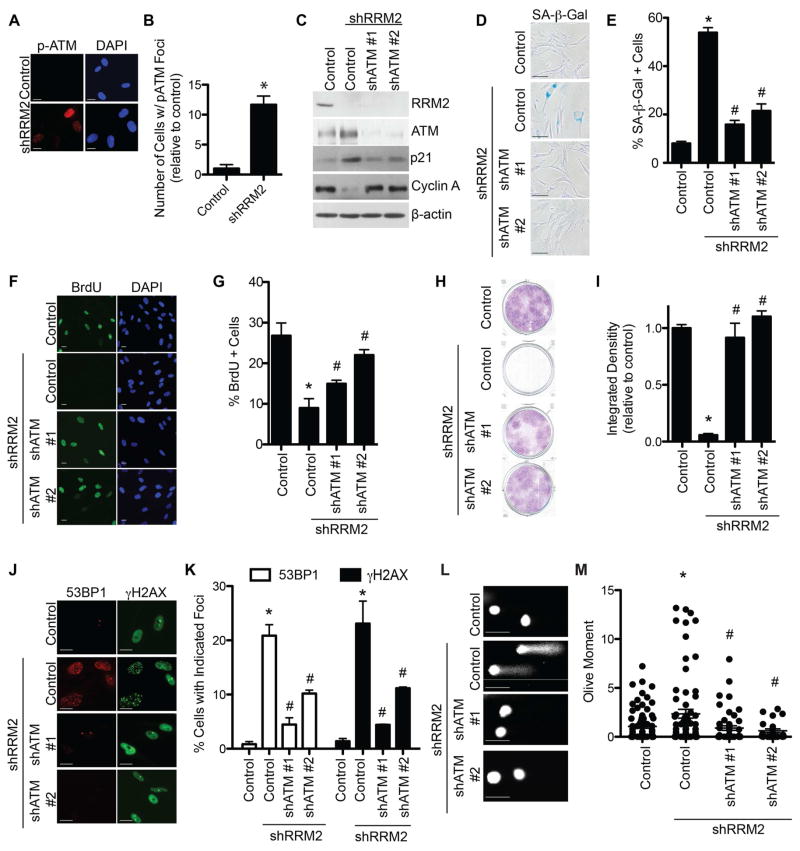
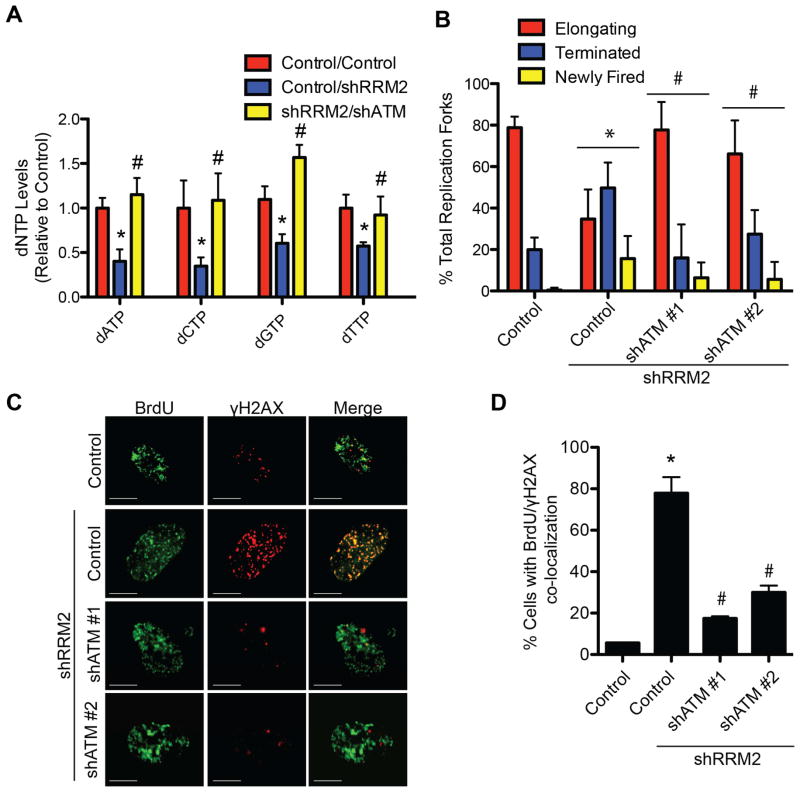
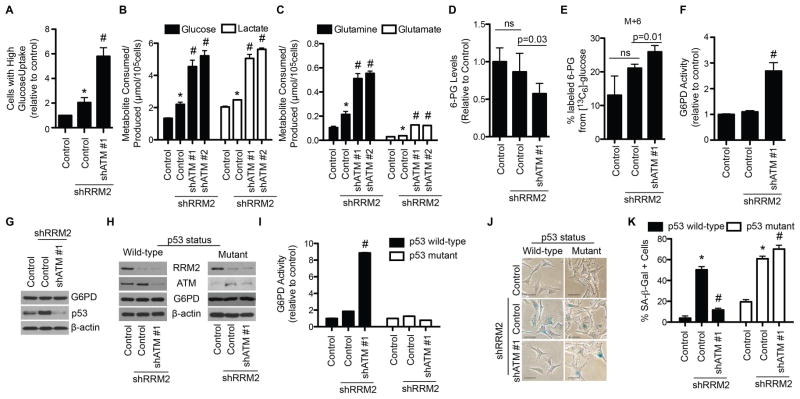
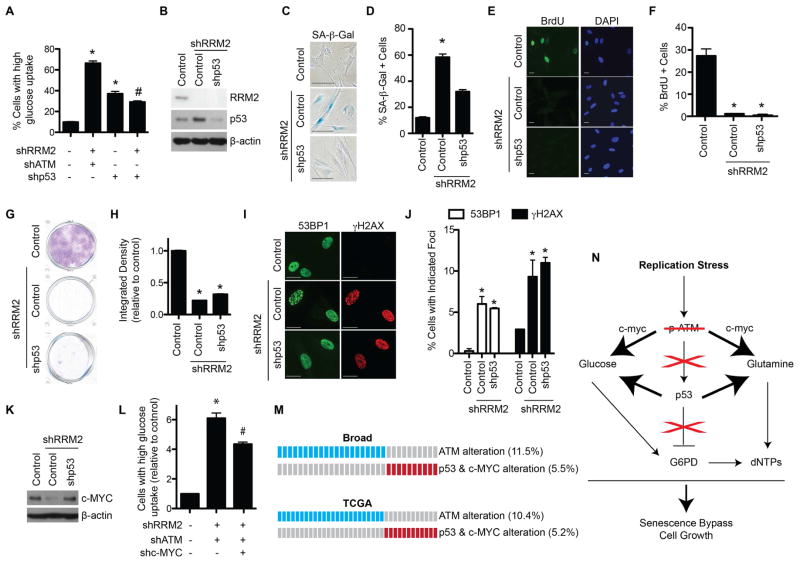
Replication stress induced by nucleotide deficiency plays an important role in cancer initiation. Replication stress in primary cells typically activates the cellular senescence tumor-suppression mechanism. Senescence bypass correlates with development of cancer, a disease characterized by metabolic reprogramming. However, the role of metabolic reprogramming in the cellular response to replication stress has been little explored. Here, we report that ataxia telangiectasia mutated (ATM) plays a central role in regulating the cellular response to replication stress by shifting cellular metabolism. ATM inactivation bypasses senescence induced by replication stress triggered by nucleotide deficiency. This was due to restoration of deoxyribonucleotide triphosphate (dNTP) levels through both upregulation of the pentose phosphate pathway via increased glucose-6-phosphate dehydrogenase (G6PD) activity and enhanced glucose and glutamine consumption. These phenotypes were mediated by a coordinated suppression of p53 and upregulation of c-MYC downstream of ATM inactivation. Our data indicate that ATM status couples replication stress and metabolic reprogramming during senescence.


Figures

Figure 1
Figure 1. Knockdown of ATM bypasses senescence and suppresses DNA damage induced by RRM2 knockdown. See also Figure S1
(A) Primary human IMR90 cells were infected with a lentivirus encoding shRRM2 or control. Cells were stained for p-ATM (Ser1981) by immunofluorescence. DAPI staining was used to visualize nuclei. (B) Quantification of (A). 200 cells from each of the indicated groups were quantified for p-ATM foci positive cells (n=3). (C) Primary human IMR90 cells were infected with a lentivirus encoding shRRM2 alone or in combination with lentivirus encoding two independent shATMs. Cells were examined for expression of RRM2, ATM, p21 and β-actin by immunoblotting. (D) Same as (C), but stained for SA-β-Gal activity. (E) Quantification of (D). 100 cells from each of the indicated groups were quantified for SA-β-Gal positivity (n=3). (F) Same as (C), but cells were labeled with BrdU for 1 h and BrdU incorporation was visualized by immunofluorescence. DAPI staining was used to visualize nuclei. (G) Quantification of (F). 200 cells from each of the indicated groups were quantified for BrdU positivity (n=3). (H) Same as (C) but an equal number of cells were seeded in 6-well plates, and focus formation was determined by crystal violet staining 14 days later. (I) Quantification of (H). The intensity of foci formed was quantified using NIH ImageJ software (n=3). (J) Same as (C), but cells were examined for 53BP1 and γH2AX foci formation. Scale bars = 5μm. (K) Quantification of (J). 200 cells from each of the indicated groups were quantified for 53BP1 and γH2AX foci positivity (n=3). (L) Same as (C), but comet assay was performed. (M) Quantification of (L). The extent of DNA damage was quantified as Olive Moment using CometScore software (n=100). *p<0.05 shRRM2 vs. control; #p<0.05 shRRM2/shATM vs. shRRM2. Error bars represent SEM. Scale bars = 10μm unless otherwise specified.
Figure 2
Figure 2. Knockdown of ATM rescues replication stress by restoring cellular dNTP levels. See also Figure S2
(A) Primary IMR90 cells were infected with a shRRM2-expressing lentivirus alone or in combination with a shATM (#1)-expressing lentivirus. dNTP levels were quantified day 1 post-drug selection (n=3). (B) Same as (A). DNA fiber analysis was conducted to observe replication fork dynamics in the indicated cells at day 1 post-drug selection. The percentage of elongating, terminated, or newly fired replication forks was quantified in the indicated cells (n=3). (C) Same as (B), but cells were labeled with BrdU for 15 min and the collapsed replication forks were visualized by co-localized BrdU and γH2AX as determined by immunofluorescence using a confocal microscope. Scale bars = 5μm. (D) Quantification of (C). 200 cells from each of the indicated groups were quantified for BrdU and γH2AX co-localization positive cells (n=3). Note that more than 10/nuclei of co-localized BrdU and γH2AX foci was considered positive. *p<0.05 shRRM2 vs. control; #p<0.05 shRRM2/shATM vs. shRRM2. Error bars represent SEM.
Figure 3
Figure 3. Senescence bypass by ATM knockdown correlates with an enhanced glucose and glutamine consumption and a metabolic shift towards the pentose phosphate pathway through an increase in G6PD activity. See also Figure S3
(A) Primary IMR90 cells were infected with a shRRM2-expressing lentivirus alone or in combination with a shATM-expressing lentivirus, and glucose uptake was determined by incubating cells with a fluorescent glucose analog (2NBDG) followed by flow cytometry (n=3). Cells were gated for high glucose uptake based on fluorescence. (B–C) Same as (A). Media was harvested, and glucose consumption and lactate production (B) or glutamine consumption and glutamate production (C) were quantified (n=3). (D–G) Same as (A). Cells were subjected to the following analysis: liquid chromatography followed by mass spectrometry (LC-MS), and shown are the relative 6-phosphogluconate (6-PG) levels normalized to cell number (n=3) (D); [13C6]-glucose labeling for 30min. Shown is the percent of 13C-labeled 6-PG (n=3) (E); glucose-6-phosphate dehydrogenase (G6PD) activity (n=3) (F); and immunoblotting of G6PD, p53 and β-actin (G). Error bars represent SD. (H) Melanoma cells with known p53 status were infected with a shRRM2-expressing lentivirus alone or in combination with a shATM (#1)-expressing lentivirus, and RRM2, ATM, G6PD, and β-actin protein expression was determined by immunoblotting. (I) Same as (H), but G6PD activity was determined (n=3). (J) Same as (H) but cells were examined for SA-β-Gal activity. Scale bars = 10μm. (K) Quantification of (J). 100 cells from each of the indicated groups were quantified for SA-β-Gal positivity (n=3). *p<0.05 shRRM2 vs. control; #p<0.05 shRRM2/shATM vs. shRRM2. Error bars represent SEM unless otherwise indicated.
Figure 4
Figure 4. ATM knockdown cooperatively inhibits p53 and upregulates c-MYC in senescence-bypassed cells. See also Figure S4 and Table S1
(A) Primary IMR90 cells were infected with lentivirus expressing the indicated shRNAs. Glucose uptake was determined by incubating cells with a fluorescent glucose analog (2NBDG) followed by flow cytometry. Cells were gated for high glucose uptake based on fluorescence (n=3). (B) Primary IMR90 cells were infected with a shRRM2-expressing lentivirus alone or in combination with a shp53-expressing lentivirus, and RRM2, p53 and β-actin protein expression was determined by immunoblotting. (C) Same as (B), but SA-β-Gal activity was determined. (D) Quantification of (C). 100 cells from each of the indicated groups were quantified for SA-β-Gal positivity (n=3). (E) Same as (B), but cells were labeled with BrdU for 1 h, and BrdU incorporation was determined by immunofluorescence. DAPI staining was used to visualize nuclei. (F) Quantification of (E). 200 cells from each of the indicated groups were quantified for BrdU positivity (n=3). (G) Same as (B), but an equal number of cells were seeded in 6-well plates and focus formation was determined by crystal violet staining 14 days later. (H) Quantification of (G). The intensity of foci was quantified using NIH ImageJ software (n=3). (I) Same as (B) but 53BP1 and γH2AX foci were observed by immunofluorescence. (J) Quantification of (I). 200 cells from each of the indicated groups were quantified for 53BP1 and γH2AX foci positive cells (n=3). (K) Primary IMR90 cells were infected with an shRRM2-expressing lentivirus alone or in combination with a shATM-expressing lentivirus, and c-MYC and β-actin protein expression was determined by immunoblotting. (L) Same as (K), but cells were also infected with a shc-MYC expressing lentivirus, and glucose uptake was determined by incubating cells with a fluorescent glucose analog (2NBDG) followed by flow cytometry (n=3). Cells were gated for high glucose uptake based on fluorescence. (M) Publically available lung adenocarcinoma databases from cBioPortal were analyzed for ATM, p53, and c-MYC status. Blue boxes indicate patients with ATM mutation or deletion. Red boxes indicate patients with p53 mutation/deletion and c-MYC amplification. (N) Schematic of senescence bypass induced by shATM. Replication stress induced by nucleotide deficiency activates ATM. If ATM is inhibited, p53 is not activated, which abrogates its inhibition of G6PD. Additionally, c-MYC expression is increased, which along with lower p53 expression, leads to increased glucose and glutamine consumption. The convergence of increased substrates and increased G6PD activity leads to increased dNTP levels, which allows for DNA replication and proliferation. *p<0.05 vs. control; #p<0.05 vs. shRRM2/shATM. Error bars represent SEM. Scale bars = 10μm.

Similar articles

Cited by

References

    1. Aird KM, Zhang G, Li H, Tu Z, Bitler BG, Garipov A, Wu H, Wei Z, Wagner SN, Herlyn M, et al. Suppression of nucleotide metabolism underlies the establishment and maintenance of oncogene-induced senescence. Cell reports. 2013;3:1252–1265. - PMC - PubMed
    1. Bartkova J, Rezaei N, Liontos M, Karakaidos P, Kletsas D, Issaeva N, Vassiliou LV, Kolettas E, Niforou K, Zoumpourlis VC, et al. Oncogene-induced senescence is part of the tumorigenesis barrier imposed by DNA damage checkpoints. Nature. 2006;444:633–637. - PubMed
    1. Bester AC, Roniger M, Oren YS, Im MM, Sarni D, Chaoat M, Bensimon A, Zamir G, Shewach DS, Kerem B. Nucleotide deficiency promotes genomic instability in early stages of cancer development. Cell. 2011;145:435–446. - PMC - PubMed
    1. Blakley RL, Vitols E. The control of nucleotide biosynthesis. Annu Rev Biochem. 1968;37:201–224. - PubMed
    1. Burhans WC, Weinberger M. DNA replication stress, genome instability and aging. Nucleic Acids Res. 2007;35:7545–7556. - PMC - PubMed

Publication types