. 2015 May 12;4(5):939-52.
doi: 10.1016/j.stemcr.2015.04.001. Epub 2015 Apr 30.

Small-molecule-driven hepatocyte differentiation of human pluripotent stem cells

Affiliations

Small-molecule-driven hepatocyte differentiation of human pluripotent stem cells

Richard Siller et al. Stem Cell Reports. .

Abstract

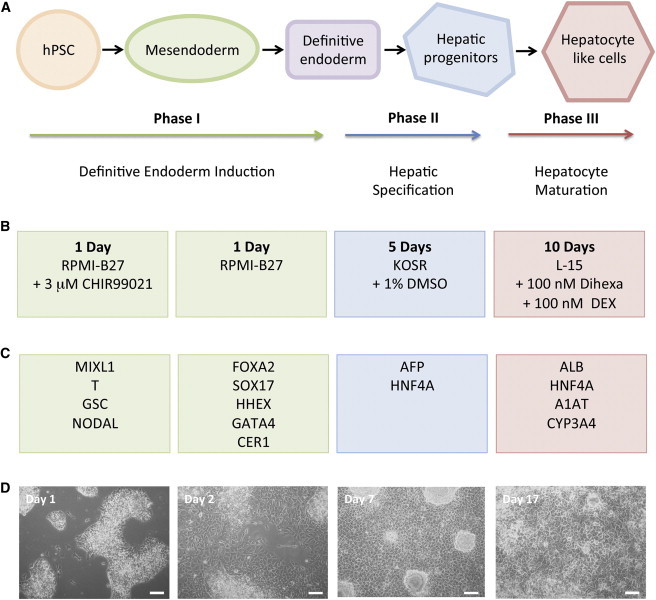
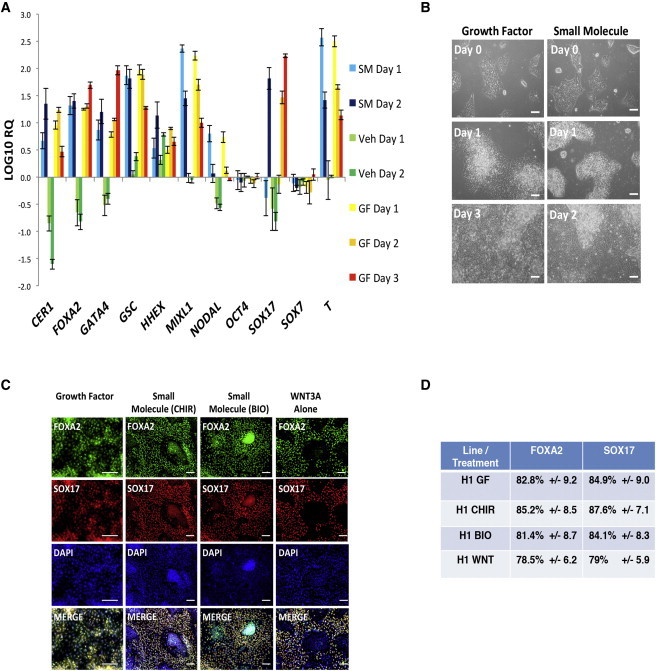
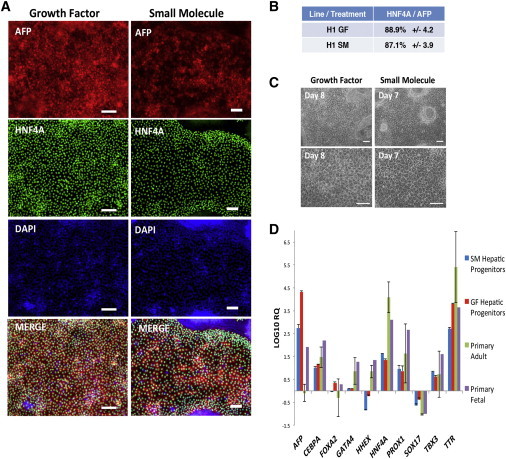
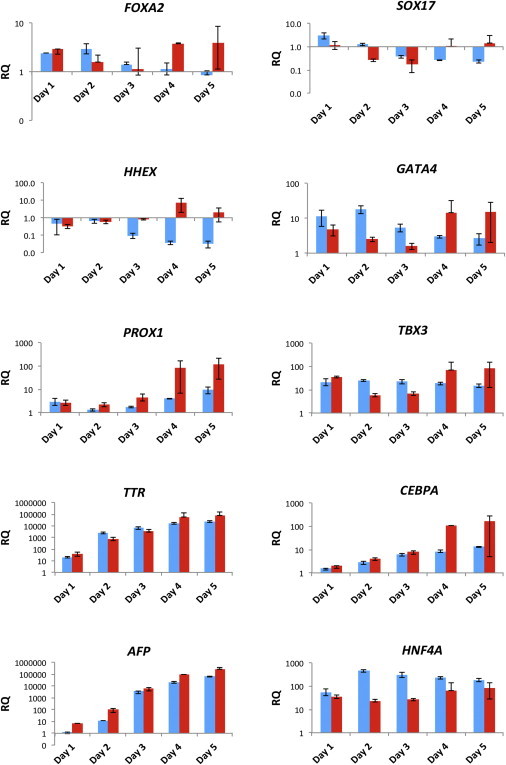
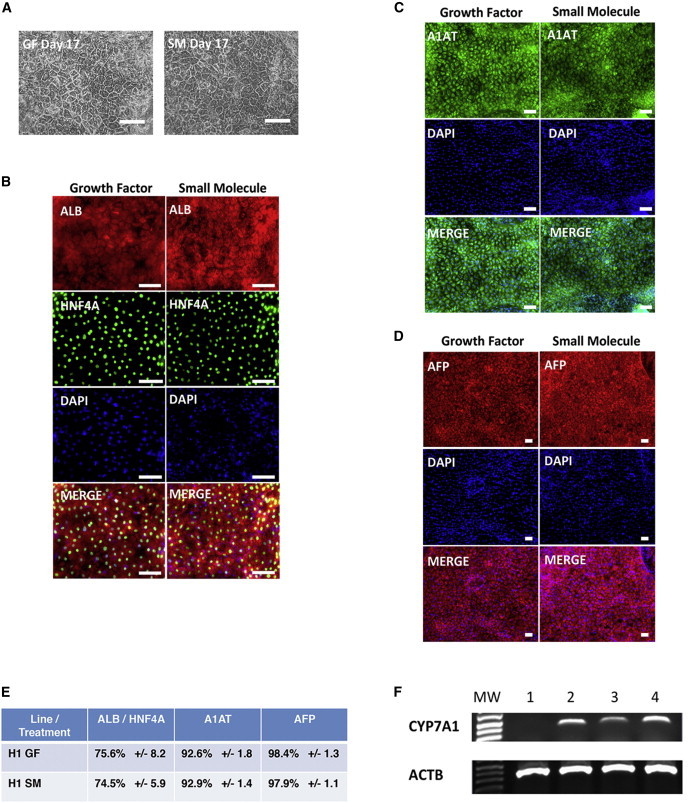
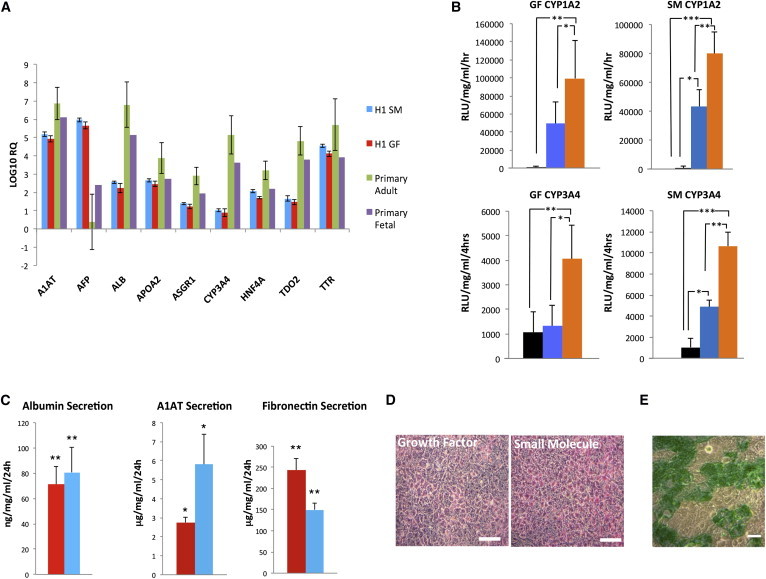
The differentiation of pluripotent stem cells to hepatocytes is well established, yet current methods suffer from several drawbacks. These include a lack of definition and reproducibility, which in part stems from continued reliance on recombinant growth factors. This has remained a stumbling block for the translation of the technology into industry and the clinic for reasons associated with cost and quality. We have devised a growth-factor-free protocol that relies on small molecules to differentiate human pluripotent stem cells toward a hepatic phenotype. The procedure can efficiently direct both human embryonic stem cells and induced pluripotent stem cells to hepatocyte-like cells. The final population of cells demonstrates marker expression at the transcriptional and protein levels, as well as key hepatic functions such as serum protein production, glycogen storage, and cytochrome P450 activity.


Figures

Figure 1
Figure 1
Schematic of the Differentiation Process (A) The normal process of differentiation and the phases of the protocol to which these apply. (B) Summary of the base media, time course, and small-molecule additions for each phase of differentiation. (C) Key markers expressed at each stage of differentiation. (D) Representative morphology of H1 cells observed at key stages of differentiation using phase contrast microscopy (10×). Scale bars, 100 μm. See also Figure S1.
Figure 2
Figure 2
Characterization of Phase I Differentiation: Definitive Endoderm (A) Gene expression changes during phase I of differentiation as measured by TaqMan qRT-PCR. Blue progression, small-molecule treatment after 24 and 48 hr. Green progression, vehicle control at 24 and 48 hr. Yellow-red progression, published growth-factor-based method (Hay et al., 2008) at 24, 48, and 72 hr. All were performed using H1 hESCs and normalized to ACTB and undifferentiated control. Data are presented as the mean of three independent experiments; error bars represent SD. (B) Comparison of morphology of growth factor and small-molecule definitive endoderm differentiation at days 0, 1, and 3 for growth factor and days 0, 1, and 2 for small molecule, taken using phase contrast microscopy (10×). Scale bars, 100 μm. (C) Expression of FOXA2 and SOX17 at phase I endpoint after treatment with activin/Wnt3a, CHIR99021, BIO, or Wnt3a alone, imaged using fluorescent microscopy. The treatment is indicated at the head of each column. Scale bars, 100 μm. (D) Efficiency of phase I differentiation, determined by counting FOXA2-positive cells and SOX17-positive cells. Efficiencies are presented as the percentage of positive cells plus or minus the SD of all fields counted. See also Figure S2.
Figure 3
Figure 3
Phase I 48-Hr Time Course to Assess Developmental Trajectory by qRT-PCR The human embryonic stem cell line H1 was differentiated in RPMI-B27 supplemented with 3 μM CHIR99021. The expression profiles of key genes were examined to establish the dynamics of the differentiation process. We monitored developmentally relevant markers of primitive streak (TMIXL1, GSC, and FOXA2), mesendoderm (T and FOXA2), and definitive endoderm (HHEX, CER1, SOX17, and FOXA2). Cells were collected for analysis every 4 hr for 48 hr (phase I: DE stage). Data are presented as the mean of three independent experiments; error bars represent SD. The x axis represents the time (in hours) after the start of differentiation. The y axis represents the log10 relative quantification (RQ) values from the TaqMan analysis. See also Figure S3.
Figure 4
Figure 4
Characterization of Phase II Differentiation: Hepatic Specification (A) Expression of AFP and HNF4A at phase II endpoint of growth-factor- and small-molecule-treated cells, imaged using fluorescent microscopy. Treatment is indicated at the head of each column. Scale bars, 100 μm. (B) Efficiency of phase II differentiation, determined by counting AFP and HNF4A double-positive cells. Efficiencies are presented as the percentage of positive cells plus or minus the SD of all fields counted. (C) Morphology at phase II endpoint, photographed using phase contrast microscopy at 10× and 20×. Scale bars, 100 μm. (D) Expression of AFP CEBPA, FOXA2, GATA4HHEX, HNF4A, PROX1, SOX17, TBX3, and TTR at phase II endpoint following either growth-factor (red) or small-molecule (blue) treatments, as measured by TaqMan. Normalized to ACTB and growth-factor- or small-molecule-derived definitive endoderm, respectively. Data are presented as the mean of three independent experiments; error bars represent SD. See also Figure S4.
Figure 5
Figure 5
Phase II 5-Day Time Course The human embryonic stem cell line H1 was differentiated to definitive endoderm using either the small-molecule (blue) or growth-factor (red) protocol. Definitive endoderm was treated with 1% DMSO to differentiate to hepatic progenitors, and cells were collected every 24 hr for 5 days to assess the gene expression of developmentally relevant hepatic markers. Data are presented as the mean of three independent experiments; error bars represent SD. The x axis represents the time (in days) after definitive endoderm. The y axis represents the RQ values from the TaqMan analysis. See also Figure S5.
Figure 6
Figure 6
Characterization of Phase III Differentiation to Hepatocyte-like Cells: Morphology and Immunofluorescence (A) Morphology of growth-factor and small-molecule protocol endpoints, taken using phase contrast microscopy at 10×. Scale bars, 100 μm. (B) Expression of albumin and HNF4A at protocol endpoints, imaged using fluorescent microscopy. Treatment is indicated at the head of each column. Scale bars, 100 μm. (C) Expression of A1AT at protocol endpoints, imaged using fluorescent microscopy. Treatment is indicated at the head of each column. Scale bars, 100 μm. (D) Expression of AFP at protocol endpoint was imaged using fluorescent microscopy. Treatment is indicated at the head of each column. Scale bars, 100 μm. (E) Efficiency of phase III differentiation, determined by counting albumin and HNF4A double-positive cells, A1AT-positive cells, and AFP-positive cells. Efficiencies are presented as the percentage of positive cells plus or minus the SD of all fields counted. (F) RT-PCR of CYP7A1 gene expression of H1-derived smHLCs. Lane 1, hESC H1 control; lanes 2–4 (top panel), H1 day 17 HLCs CYP7A1 expression; lanes 2–4 (lower panel), ACTB loading control. See also Figure S6.
Figure 7
Figure 7
Characterization of Phase III Differentiation to Hepatocyte-like Cells: qRT-PCR and Functional Analysis (A) Expression of A1AT (SERPINA1), AFP, ALB, APOA2, ASGR1, CYP3A4, HNF4A, TDO2, and TTR at endpoint of small-molecule (blue) and growth-factor (red) protocols, as well as primary adult and fetal hepatocyte controls, assessed by TaqMan. Normalized to ACTB and small-molecule- or growth-factor-derived definitive endoderm, respectively. Data are presented as the mean of three independent experiments; error bars represent SD. Because only one primary fetal control was run, no error bars are present. (B) Cytochrome P450 1A2 and 3A4 activity and induction were assessed in both smHLCs (SM) and growth-factor-derived HLCs (GF). The black columns represent hESC H1 pluripotent control, the blue columns represent basal activity, and the orange columns represent activity after induction with either omeprazole (1A2) or rifampicin (3A4). Data are presented as the mean of six independent experiments; error bars represent SD (n = 6 biological replicates). GF CYP1A2 p < 0.05, ∗∗p < 0.002; SM CYP1A2 p < 0.02, ∗∗p < 0.01; ∗∗∗p < 0.001. GF CYP3A4 p < 0.001, ∗∗p < 0.005; SM CYP3A4 p < 0.004, ∗∗p < 0.0002; ∗∗∗p < 2 × 10−5. (C) Serum protein secretion at endpoint of both growth-factor- (red) and small-molecule-based (blue) protocols. Data are presented as the mean of three independent experiments; error bars represent SD. p < 0.09, ∗∗p < 0.004, compared to control. (D) Glycogen storage in growth-factor- and small-molecule-differentiated cells as indicated by PAS staining. Treatment is indicated top left of each panel. Scale bars, 100 μm. (E) H1 smHLCs treated for 1 hr with 1 mg/ml indocyanine green demonstrate uptake as assessed by phase microscopy. Scale bars, 100 μm. See also Figure S7.

References

    1. Agarwal S., Holton K.L., Lanza R. Efficient differentiation of functional hepatocytes from human embryonic stem cells. Stem Cells. 2008;26:1117–1127. - PubMed
    1. Ang S.L., Wierda A., Wong D., Stevens K.A., Cascio S., Rossant J., Zaret K.S. The formation and maintenance of the definitive endoderm lineage in the mouse: involvement of HNF3/forkhead proteins. Development. 1993;119:1301–1315. - PubMed
    1. Asahina K., Fujimori H., Shimizu-Saito K., Kumashiro Y., Okamura K., Tanaka Y., Teramoto K., Arii S., Teraoka H. Expression of the liver-specific gene Cyp7a1 reveals hepatic differentiation in embryoid bodies derived from mouse embryonic stem cells. Genes Cells. 2004;9:1297–1308. - PubMed
    1. Baharvand H., Hashemi S.M., Kazemi Ashtiani S., Farrokhi A. Differentiation of human embryonic stem cells into hepatocytes in 2D and 3D culture systems in vitro. Int. J. Dev. Biol. 2006;50:645–652. - PubMed
    1. Basma H., Soto-Gutiérrez A., Yannam G.R., Liu L., Ito R., Yamamoto T., Ellis E., Carson S.D., Sato S., Chen Y. Differentiation and transplantation of human embryonic stem cell-derived hepatocytes. Gastroenterology. 2009;136:990–999. - PMC - PubMed

MeSH terms