Review
. 2015 Nov 1:89:99-111.
doi: 10.1016/j.ymeth.2015.04.031. Epub 2015 May 1.

Probing structures of large protein complexes using zero-length cross-linking

Affiliations
Review

Probing structures of large protein complexes using zero-length cross-linking

Roland F Rivera-Santiago et al. Methods. .

Abstract

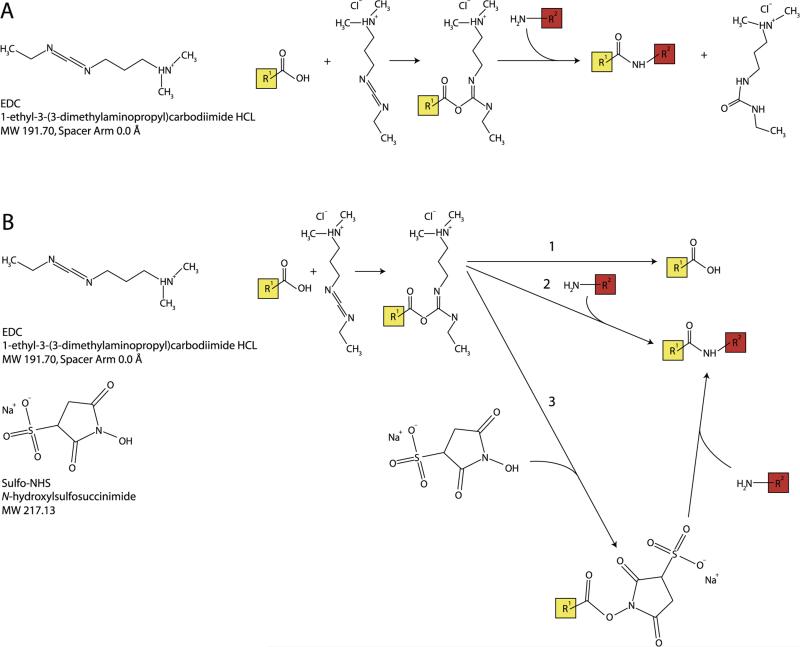
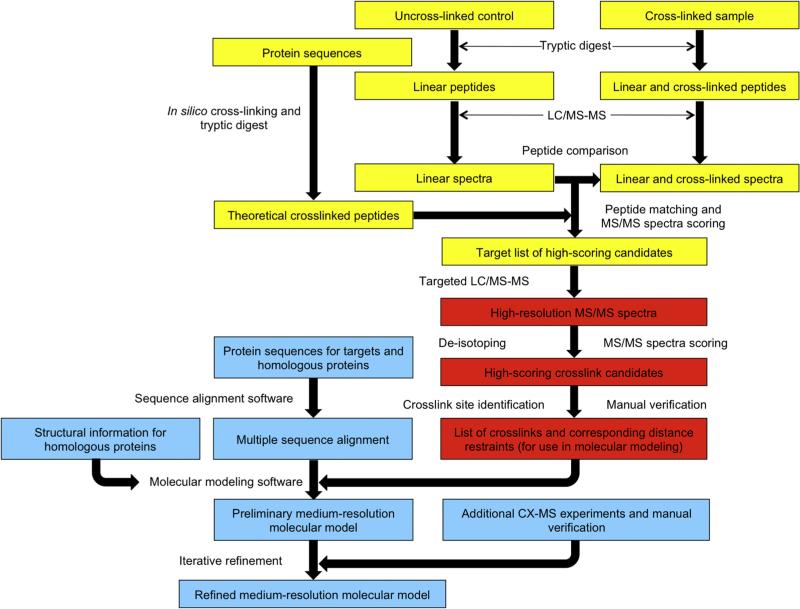
Structural mass spectrometry (MS) is a field with growing applicability for addressing complex biophysical questions regarding proteins and protein complexes. One of the major structural MS approaches involves the use of chemical cross-linking coupled with MS analysis (CX-MS) to identify proximal sites within macromolecules. Identified cross-linked sites can be used to probe novel protein-protein interactions or the derived distance constraints can be used to verify and refine molecular models. This review focuses on recent advances of "zero-length" cross-linking. Zero-length cross-linking reagents do not add any atoms to the cross-linked species due to the lack of a spacer arm. This provides a major advantage in the form of providing more precise distance constraints as the cross-linkable groups must be within salt bridge distances in order to react. However, identification of cross-linked peptides using these reagents presents unique challenges. We discuss recent efforts by our group to minimize these challenges by using multiple cycles of LC-MS/MS analysis and software specifically developed and optimized for identification of zero-length cross-linked peptides. Representative data utilizing our current protocol are presented and discussed.

Keywords: Chemical cross-linking; Cross-link identification; Mass spectrometry; Molecular modeling; Structure; Zero-length cross-linking.


Figures

Fig. 1
Fig. 1
Zero-length cross-linking reaction chemistry. (A) Chemical formula for EDC (left) and forward cross-linking reaction involving an acylisourea intermediate (right) (B) Chemical formulas for EDC and sulfo-NHS (left) and reaction chemistry for zero-length cross-linking reaction, including: (1) the reverse reaction, (2) cross-link formation, and (3) stabilization of the acylisourea intermediate via substitution for an amine-reactive sulfo-NHS ester, followed by cross-link formation.
Fig. 2
Fig. 2
Diagram for the zero-length CX-MS cross-linking protocol, as optimized for a LTQ Orbitrap MS instrument. [66] The protocol is separated into 3 major categories: sample preparation, label-free comparison, and comparison to all possible theoretical cross-linked peptides (in yellow), database search of candidate spectra and cross-link identification (in red), and incorporation of distance restraints into homology modeling experiments (in light blue).
Fig. 3
Fig. 3
High-resolution MS/MS spectra are required for high-confidence identification of cross-linked peptides. In a zero-length cross-linking study of a large 526 kDa spectrin heterodimer using an Orbitrap XL mass spectrometer, a typical MS/MS scan can be matched to as many as 97 distinct theoretical cross-linked peptides within a 10-ppm mass tolerance range. Red highlights the correct assignment. The geometric mean (GM) score [66] represents the quality of a match between a cross-link sequence and an MS/MS spectrum. (A) Analysis of low-resolution MS/MS data cannot distinguish between the 97 alternative theoretical cross-linked peptides. (B) With high-resolution MS/MS data, only a single correct assignment stands out with a non-zero score.
Fig. 4
Fig. 4
XlinkInspector is a graphical interface within ZXMiner that aids verification of cross-linked peptide assignment and determination of cross-linked sites. (A) The tabbed interface allows quick navigation between individual cross-link assignments for visual inspection of data quality. (B) The header displays basic information about the selected MS/MS spectrum. (C) This more detailed interface provides flexibility for spectrum annotation and plotting. (D) The list of identified fragmented ions can be exported for further inspection. The annotated spectrum can also be exported in publication-ready Scalable Vector Graphics format (SVG). (E) Visual representation of the identified b- and y-ions on the two peptide sequences. The assigned cross-linked residues are highlighted in red. (F) Color-coded plot of MS/MS data. Identified major b- and y-ions are shown in green. Neutral losses are shown in blue. Precursor-related ions are shown in red. Yellow and pink cutoff lines indicate minimum intensity values required to be designated as a peak or scored in the GM scoring algorithm, respectively. (G) Alternative cross-linked sites are listed along with their respective coverage scores. Annotation of the MS/MS spectrum dynamically changes in panel F when different cross-link sites are selected in panel G.
Fig 5
Fig 5
Analysis of GST cross-links using ZXMiner. Reproduced with permission from [66]. (A) Locations of identified cross-links on the crystal structure of the GST homodimer (PDB ID: 1GTA). Lys residues are highlighted in blue and Glu and Asp are in red. The black lines connect the two α-carbons of each cross-link. Cross-links between residues whose Cα–Cα distances are significantly larger than 12 Å were highlighted in orange. (B) Scatter plot showing the relationship between GM scores derived from high-resolution MS/MS data and Cα–Cα distances for all cross-linked peptide candidates in the GST data set. A few cross-links located in regions likely to exhibit increased flexibility, such as loops or inter-subunit interfaces, slightly exceeded the expected 12 Å maximum Cα–Cα distance. (C) ROC curves showing the superior performance of high-resolution MS/MS data (area under the curve = 0.99) compared with low-resolution data (area under the curve = 0.80).
Fig. 6
Fig. 6
Solution structures for mini-spectrin tetramer based on zero-length CX-MS data analysis using ZXMiner. Adapted from [2] with permission. (A) Locations of interdomain cross-links used to model mini-spectrin tetramer. Blue lines indicate cross-links identified previously (65); red lines indicate new cross-links identified using the ZXMiner workflow; dashed lines indicate the same cross-links repeated in the second half of the tetramer. (B) Superimposition of present and previous tetramer structures. (C) Space-filling representations of tetramer models. β-spectrin domains are colored in bright or pale cyan, and α-spectrin domains are colored in bright or pale orange to distinguish the two strands.
Fig. 7
Fig. 7
Zero-Length CX-MS enables identification and modeling of large changes in conformation for mini-spectrin dimers. Adapted from [2] with permission. (A) Open dimerspecific cross-links indicative of nonhelical connectors before (left) and after (right) structural refinement. Lys residues in blue; Glu/Asp residues in red; green lines are cross-links with labeled Cα–Cα distances. (B) Open dimer model supported by two cross-links between α0 and α1 domains. (C) Structures showing the interconversion between fully extended open dimer to closed dimer.
Fig. 8
Fig. 8
Cross-links and structure for the L207P mutant mini-spectrin dimer. Reproduced from [2] with permission. (A) Locations of αL207P inter-domain cross-links; the asterisk indicates the location of the aL207P mutation. (B) Locations of five αL207P mutant-specific cross-links indicative of conformational rearrangements in the α1–α2–α3 region plotted on the WT structure for comparison; blue, Lys; red, Glu/Asp; black, Pro mutation; black lines, cross-links with Cα–Cα distances labeled. (C) Model of the aL207P mutant closed dimer. (D) Cα–Cα distances for inter-domain cross-links identified in the αL207P mutant dimer on the WT and αL207P closed dimer structures. (E) Superimposition of a2 domains from the WT and αL207P closed dimer. The mutated residue is shown in black.
Fig. 9
Fig. 9
Schematics of spectrin heterodimers with identified cross-links. Adapted from [66] with permission. Cross-links that fit the known domain structure and lateral alignment of the subunits are indicated by red lines, while those indicative of the protein folding back upon itself are shown by dashed blue lines. (A) Spectrin heterodimer with cross-links identified using purified heterodimers in solution. (B) Cross-links identified using intact membranes and isolated membrane cytoskeletons.

References

    1. Olson AL, Tucker AT, Bobay BG, Soderblom EJ, Moseley MA, Thompson RJ, Cavanagh J. Structure. 2014 - PMC - PubMed
    1. Sriswasdi S, Harper SL, Tang HY, Gallagher PG, Speicher DW. Proc. Natl. Acad. Sci. U.S.A. 2014;111:1801–1806. - PMC - PubMed
    1. Greber BJ, Boehringer D, Leibundgut M, Bieri P, Leitner A, Schmitz N, Aebersold R, Ban N. Nature. 2014;515:283–286. - PubMed
    1. Lasker K, Forster F, Bohn S, Walzthoeni T, Villa E, Unverdorben P, Beck F, Aebersold R, Sali A, Baumeister W. Proc. Natl. Acad. Sci. U.S.A. 2012;109:1380–1387. - PMC - PubMed
    1. Konijnenberg A, Butterer A, Sobott F. Biochim. Biophys. Acta. 2013;1834:1239–1256. - PubMed

Publication types

MeSH terms

Substances

LinkOut - more resources