Review
. 2015 Jul;84(7):1259-68.
doi: 10.1016/j.ejrad.2015.03.017. Epub 2015 Mar 23.

Cancer immunotherapy and immune-related response assessment: The role of radiologists in the new arena of cancer treatment

Affiliations
Review

Cancer immunotherapy and immune-related response assessment: The role of radiologists in the new arena of cancer treatment

Mizuki Nishino et al. Eur J Radiol. 2015 Jul.

Abstract

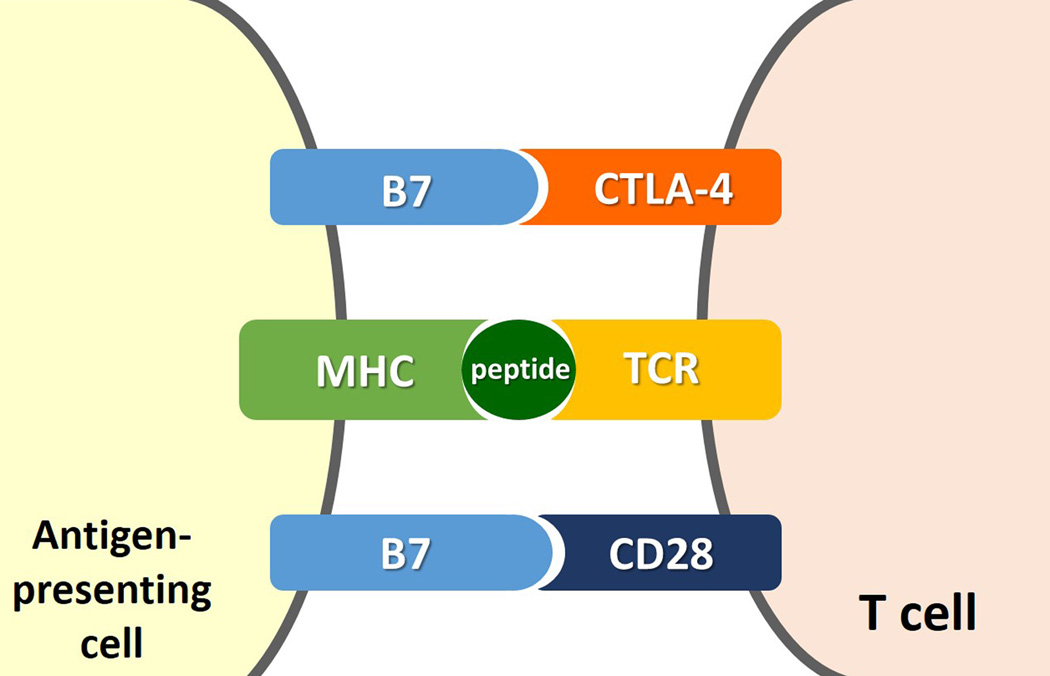
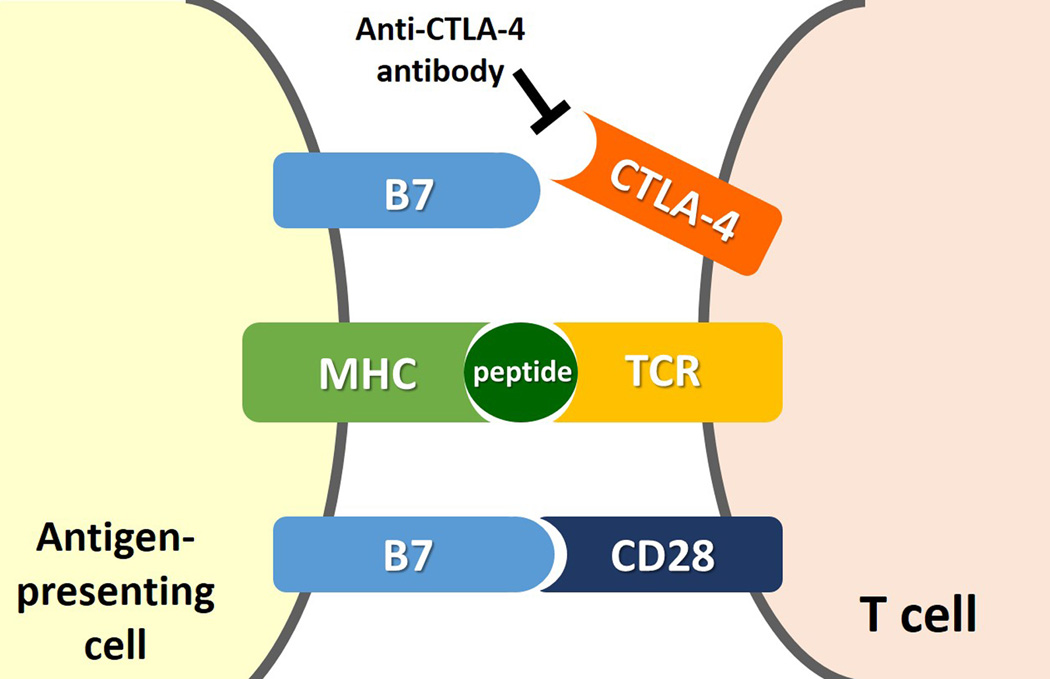
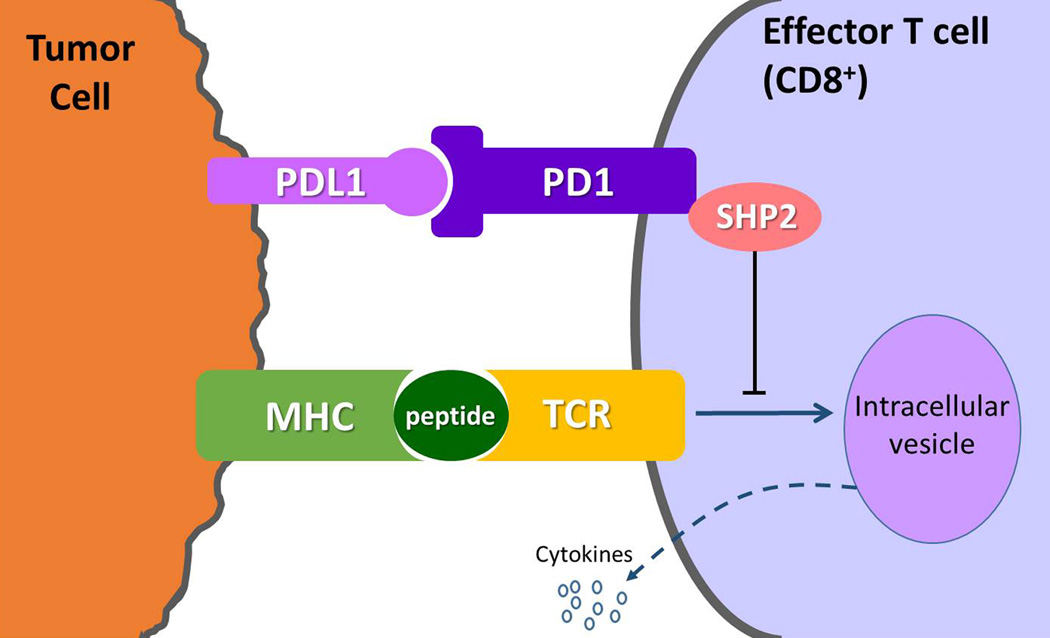
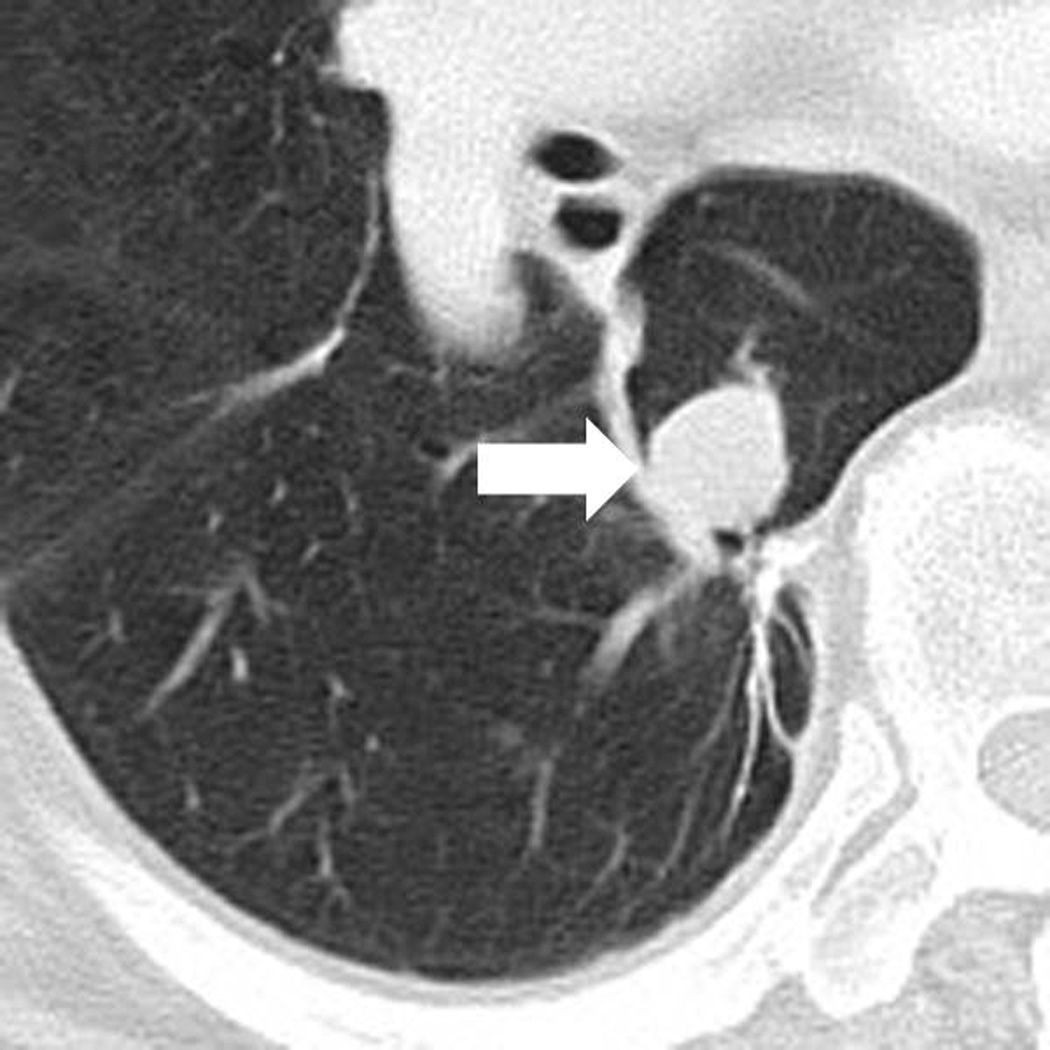
The recent advances in the clinical application of anti-cancer immunotherapeutic agents have opened a new arena for the treatment of advanced cancers. Cancer immunotherapy is associated with a variety of important radiographic features in the assessments of tumor response and immune-related adverse events, which calls for radiologists' awareness and in-depth knowledge on the topic. This article will provide the state-of-the art review and perspectives of cancer immunotherapy, including its molecular mechanisms, the strategies for immune-related response assessment on imaging and their pitfalls, and the emerging knowledge of radiologic manifestations of immune-related adverse events. The cutting edge clinical and radiologic investigations are presented to provide future directions.

Keywords: Cancer; Drug toxicity; Immunotherapy; Oncologic imaging; Tumor response assessment.


Conflict of interest statement

Conflict of Interest:

Dr. Nishino served as a consultant to Bristol-Myers Squibb. Dr. Hodi has served as a non-paid consultant to Bristol-Myers Squibb and has received clinical trial support from Bristol-Myers Squibb, advisor and clinical trial support from Merck, and advisor and clinical trial support from Genentech. Other authors have nothing to disclose.

Figures

Fig 1
Fig 1
Molecular mechanisms for immune inhibition by tumors and its blockade by anti-CTLA-4 antibody. (Modified from Refs [40, 42]: N Engl J Med 2014;371:2189-99 and N Engl J Med. 2014;371: 2230–2232). A. Interaction between CTLA-4 on T cell and its ligand (B7) on antigen-presenting cell inhibits the T cell immune response against tumor, allowing tumor cells escape from immune attack. B. Anti-CTLA-4 antibodies, such as ipilimumab, block the interaction between CTLA-4 and its ligand, causing blockade of the T cell immune inhibition and thus activating immune response against cancer.
Fig 1
Fig 1
Molecular mechanisms for immune inhibition by tumors and its blockade by anti-CTLA-4 antibody. (Modified from Refs [40, 42]: N Engl J Med 2014;371:2189-99 and N Engl J Med. 2014;371: 2230–2232). A. Interaction between CTLA-4 on T cell and its ligand (B7) on antigen-presenting cell inhibits the T cell immune response against tumor, allowing tumor cells escape from immune attack. B. Anti-CTLA-4 antibodies, such as ipilimumab, block the interaction between CTLA-4 and its ligand, causing blockade of the T cell immune inhibition and thus activating immune response against cancer.
Fig. 2
Fig. 2
Mechanism of PD-1 immunosupression as a target for cancer therapy. (Modified from Refs [–33]. Clin Cancer Res. 2012;18: 6580–6587, Nat Rev Cancer. 2012;12: 252–264; Nat Immunol. 2013;14: 1212–1218). PD-1 is expressed on the surface of effector T cells upon activation, and its ligand, PD-L1 is expressed on the tumor cells either by constitutive oncogenic signaling or by the induction in response to inflammatory signals as a response to tumor. The binding of PD-L1 to PD-1 delivers an inhibitory signal, through the phosphatase SHP2, which reduces cytokine production and proliferation of T cells, thus enabling tumor cells to evade the host immune response. Antibodies against PD-1 or PD-L1 prevent the binding and block immune inhibition by tumor, inducing anti-tumor immune response. Multiple additional receptor-ligand interactions that regulate T cell responses in the tumor microenvironment have been identified, such as KIR (killer cell immunoglobulin-like receptor), LAG3 (lymphocyte activation gene 3), and TIM3 (T cell membrane protein 3), and are currently under active investigation as possible targets for cancer immunotherapy.
Fig. 3
Fig. 3
Response after an initial increase in total tumor burden in a 77 year-old male with advanced melanoma treated with ipilimumab. A. The baseline CT scan demonstrated a lung lesion (arrow) measuring 19 mm in the longest diameter. B. At 12 weeks of therapy, the lesion (arrow) measured 29 mm, demonstrating 53% increase comparing to the baseline, indicating progressive disease by RECIST. C. The patient remained on therapy and another follow-up CT at 24 weeks showed a reduction of the lesion (arrow), measuring 12 mm, indicating immune-related response to therapy.
Fig. 3
Fig. 3
Response after an initial increase in total tumor burden in a 77 year-old male with advanced melanoma treated with ipilimumab. A. The baseline CT scan demonstrated a lung lesion (arrow) measuring 19 mm in the longest diameter. B. At 12 weeks of therapy, the lesion (arrow) measured 29 mm, demonstrating 53% increase comparing to the baseline, indicating progressive disease by RECIST. C. The patient remained on therapy and another follow-up CT at 24 weeks showed a reduction of the lesion (arrow), measuring 12 mm, indicating immune-related response to therapy.
Fig. 4
Fig. 4
Bidimensional versus unidimensional measurements for tumor response assessment. Baseline CT scan prior to ipilimumab therapy in a 51-year-old female with metastatic melanoma demonstrated a target lesion in the lung, measuring 16.4 cm2 (4.2×3.9 cm) by bidimensional measurements and 4.2 cm by uindimensional, longest diameter measurement.
Fig. 5
Fig. 5
Comparison between irRC using bidimensional measurements and the irRC using unidimensional measurements. (Reprinted with permission from Ref. : Clin Cancer Res. 2013;19:3936-43.) A. The percent changes according to bidimensional and unidimensional measurements at each follow-up scan from the 1st to 17th follow-up scans. The orange dashed lines represent the cut-off values for response and progression (−50% and +25% for bidimensional measurements, −30% and +20% for unidimensional measurements). The observations within the top left, middle center, and top right boxes have concordant assessment between tow measurements, whereas observations in other boxes have discordant assessment. The purple dashed line represents +44% change for bidimensional measurements, which corresponds to +20% change for unidimensional measurements, which was given to visually demonstrate that more observations are concordant if this cut-off value is used. The percent changes presented in the figure are in comparison with baseline measurements when tumors are decreasing to assess response and in comparison with the nadir (the smallest measurement since baseline) when tumors are increasing to assess progression. These values are displayed as they are used to define response/progression in patients at the time of response assessment. B. TTP according to bidimensional versus unidimensional assessment. Estimates of the 25th percentile (time point at which 75% are free of progression) were 5.3 months (95% CI, 3.5–∞) by bidimensional assessment versus 9.1 months (95% CI, 3.7–∞) by unidimensional assessment. On the basis of the almost identical confidence intervals for the 25 percentile, there is no evidence of a difference in TTP between the 2 methods of assessment.
Fig. 5
Fig. 5
Comparison between irRC using bidimensional measurements and the irRC using unidimensional measurements. (Reprinted with permission from Ref. : Clin Cancer Res. 2013;19:3936-43.) A. The percent changes according to bidimensional and unidimensional measurements at each follow-up scan from the 1st to 17th follow-up scans. The orange dashed lines represent the cut-off values for response and progression (−50% and +25% for bidimensional measurements, −30% and +20% for unidimensional measurements). The observations within the top left, middle center, and top right boxes have concordant assessment between tow measurements, whereas observations in other boxes have discordant assessment. The purple dashed line represents +44% change for bidimensional measurements, which corresponds to +20% change for unidimensional measurements, which was given to visually demonstrate that more observations are concordant if this cut-off value is used. The percent changes presented in the figure are in comparison with baseline measurements when tumors are decreasing to assess response and in comparison with the nadir (the smallest measurement since baseline) when tumors are increasing to assess progression. These values are displayed as they are used to define response/progression in patients at the time of response assessment. B. TTP according to bidimensional versus unidimensional assessment. Estimates of the 25th percentile (time point at which 75% are free of progression) were 5.3 months (95% CI, 3.5–∞) by bidimensional assessment versus 9.1 months (95% CI, 3.7–∞) by unidimensional assessment. On the basis of the almost identical confidence intervals for the 25 percentile, there is no evidence of a difference in TTP between the 2 methods of assessment.
Fig. 6
Fig. 6
Interobserver variability of bidimensional and unidimensional measurements. (Reprinted with permission from Ref. : Clin Cancer Res. 2013;19:3936-43.) Bland–Altman plots show interobserver variability of bidimensional and unidimensional measurements on baseline scans in 25 patients. The 95% limits of agreement of bidimensional measurements were (−31.3%, 19.7%; A, dashed lines), that were twice wider compared with those of unidimensional measurements (−16.1%, 5.8%; B, dashed lines). The dotted lines represent the mean relative difference (%).
Fig. 7
Fig. 7
Comparison between irRC simulating RECIST1.0 and irRC simulating RECIST1.1. Reprinted with permission from Ref. : J Immunother Cancer. 2014 Jun 18;2:17.) A. The percent changes of measurements using irRC simulating RECIST1.0 and irRC simulating RECIST1.1 at each follow-up from the 1st to the 17th follow-up scans are shown. Dashed lines at +20% and −30% represent the cut-off values for progressive disease and partial response, respectively. The observations within the lower left, middle center, and upper right boxes have concordant assessment between tow measurements, while observations in other boxes have discordant assessment. One concordant observation (+80% by irRC simulating RECIST1.0, +330% irRC simulating RECIST1.1) is not displayed since it is beyond the range of the Y axis. The percent changes presented in the figure are in comparison with baseline measurements when tumors are decreasing to assess response, and in comparison with the nadir (the smallest measurement since baseline) when tumors are increasing to assess progression. These values are displayed since they are used to define response/progression in patients at the time of response assessment. Please also note that the number of patients decreases as the follow-up proceeds, starting from 71 patients at 1st follow-up, 43 patients at the 2nd follow-up, 27 patients at the 3rd follow-up, and so on. There were 3 patients at the 12th–14th follow-up, 2 patients at 15th and 16th follow-up, and one follow-up at the 17th follow-up. B. Time to progression by irRC simulating RECIST1.1 and irRC simulating RECIST1.0 had a median survival of 26.9 months (95% CI: 9.1–∞), without evidence of difference.
Fig. 7
Fig. 7
Comparison between irRC simulating RECIST1.0 and irRC simulating RECIST1.1. Reprinted with permission from Ref. : J Immunother Cancer. 2014 Jun 18;2:17.) A. The percent changes of measurements using irRC simulating RECIST1.0 and irRC simulating RECIST1.1 at each follow-up from the 1st to the 17th follow-up scans are shown. Dashed lines at +20% and −30% represent the cut-off values for progressive disease and partial response, respectively. The observations within the lower left, middle center, and upper right boxes have concordant assessment between tow measurements, while observations in other boxes have discordant assessment. One concordant observation (+80% by irRC simulating RECIST1.0, +330% irRC simulating RECIST1.1) is not displayed since it is beyond the range of the Y axis. The percent changes presented in the figure are in comparison with baseline measurements when tumors are decreasing to assess response, and in comparison with the nadir (the smallest measurement since baseline) when tumors are increasing to assess progression. These values are displayed since they are used to define response/progression in patients at the time of response assessment. Please also note that the number of patients decreases as the follow-up proceeds, starting from 71 patients at 1st follow-up, 43 patients at the 2nd follow-up, 27 patients at the 3rd follow-up, and so on. There were 3 patients at the 12th–14th follow-up, 2 patients at 15th and 16th follow-up, and one follow-up at the 17th follow-up. B. Time to progression by irRC simulating RECIST1.1 and irRC simulating RECIST1.0 had a median survival of 26.9 months (95% CI: 9.1–∞), without evidence of difference.
Fig. 8
Fig. 8
Ipilimumab-associated hypophysitis in a 56-year-old woman with metastatic melanoma. A, B. T1-weighted sagittal MR images of the brain prior to (A) and after (B) the administration of the intravenous contrast agent (gadobutrol) at 7 weeks since the initiation of ipilimumab therapy demonstrated a new marked enlargement of the pituitary gland with enhancement, indicating ipilimumab-associated hypophysitis. The study was negative for brain metastasis. The subsequent endocrinology work-up also revealed hypophysitis-related central hypothyroidism and secondary adrenal insufficiency. The patient was treated with oral predonisone and the follow-up MR imaging after 8 months since the last dose of ipilimumab showed the resolution of pituitary gland enlargement (not shown).
Fig. 8
Fig. 8
Ipilimumab-associated hypophysitis in a 56-year-old woman with metastatic melanoma. A, B. T1-weighted sagittal MR images of the brain prior to (A) and after (B) the administration of the intravenous contrast agent (gadobutrol) at 7 weeks since the initiation of ipilimumab therapy demonstrated a new marked enlargement of the pituitary gland with enhancement, indicating ipilimumab-associated hypophysitis. The study was negative for brain metastasis. The subsequent endocrinology work-up also revealed hypophysitis-related central hypothyroidism and secondary adrenal insufficiency. The patient was treated with oral predonisone and the follow-up MR imaging after 8 months since the last dose of ipilimumab showed the resolution of pituitary gland enlargement (not shown).
Fig. 9
Fig. 9
Ipilimumab-associated sarcoid-like mediastinal and hilar lymphadenopathy in a 73-year-old woman with metastatic melanoma. A, B. Coronal maximum intensity projection (A) and axial fused FDG-PET/CT (B) images 3 months after the initiation of ipilimumab treatment demonstrated new FDG-avid mediastinal and hilar adenopathy mimicking sarcoidosis. Patient was asymptomatic at this time. A follow-up PET/CT 2 months later showed spontaneous resolution of the FDG-avid adenopathy (not shown).
Fig. 9
Fig. 9
Ipilimumab-associated sarcoid-like mediastinal and hilar lymphadenopathy in a 73-year-old woman with metastatic melanoma. A, B. Coronal maximum intensity projection (A) and axial fused FDG-PET/CT (B) images 3 months after the initiation of ipilimumab treatment demonstrated new FDG-avid mediastinal and hilar adenopathy mimicking sarcoidosis. Patient was asymptomatic at this time. A follow-up PET/CT 2 months later showed spontaneous resolution of the FDG-avid adenopathy (not shown).
Fig. 10
Fig. 10
Ipilimumab-associated colitis with a diffuse colitis pattern in an 81-year-old man with watery diarrhea during ipilimumab treatment. Coronal contrast-enhanced CT images at 3 months since the initiation of ipilimumab therapy demonstrated a new fluid-filled colonic distention with mild mesenteric vessel engorgement consistent with diffuse colitis. Also note metastatic lesions in the liver. Colonoscopic biopsy confirmed colonic inflammation consistent with drug induced mucosal injury.
Fig. 11
Fig. 11
Ipilimumab-associated colitis with a segmental colitis associated with diverticulosis (SCAD) pattern in a 55-year-old man who presented with diarrhea during ipilimumab treatment. A, B. Axial (A) and coronal (B) contrast-enhanced CT images performed 3 months after start of treatment with ipilimumab showed segmental colitis associated with diverticulosis (SCAD) pattern, demonstrating severe segmental wall thickening of the sigmoid colon and pericolic fat stranding.
Fig. 11
Fig. 11
Ipilimumab-associated colitis with a segmental colitis associated with diverticulosis (SCAD) pattern in a 55-year-old man who presented with diarrhea during ipilimumab treatment. A, B. Axial (A) and coronal (B) contrast-enhanced CT images performed 3 months after start of treatment with ipilimumab showed segmental colitis associated with diverticulosis (SCAD) pattern, demonstrating severe segmental wall thickening of the sigmoid colon and pericolic fat stranding.

References

    1. Freeman GJ, Long AJ, Iwai Y, et al. Engagement of the PD-1 immunoinhibitory receptor by a novel B7 family member leads to negative regulation of lymphocyte activation. J Exp Med. 2000;192:1027–1034. - PMC - PubMed
    1. Leach DR, Krummel MF, Allison JP. Enhancement of antitumor immunity by CTLA-4 blockade. Science. 1996;271:1734–1736. - PubMed
    1. Brunet JF, Denizot F, Luciani MF, et al. A new member of the immunoglobulin superfamily--CTLA-4. Nature. 1987;328:267–270. - PubMed
    1. Freeman GJ, Gribben JG, Boussiotis VA, et al. Cloning of B7-2: a CTLA-4 counter-receptor that costimulates human T cell proliferation. Science. 1993;262:909–911. - PubMed
    1. Ishida Y, Agata Y, Shibahara K, Honjo T. Induced expression of PD-1, a novel member of the immunoglobulin gene superfamily, upon programmed cell death. EMBO J. 1992;11:3887–3895. - PMC - PubMed

Publication types

MeSH terms