. 2015 May 4;10(5):e0125718.
doi: 10.1371/journal.pone.0125718. eCollection 2015.

Bariatric Surgery Induces Disruption in Inflammatory Signaling Pathways Mediated by Immune Cells in Adipose Tissue: A RNA-Seq Study

Affiliations

Bariatric Surgery Induces Disruption in Inflammatory Signaling Pathways Mediated by Immune Cells in Adipose Tissue: A RNA-Seq Study

Christine Poitou et al. PLoS One. .

Abstract

Background: Bariatric surgery is associated to improvements in obesity-associated comorbidities thought to be mediated by a decrease of adipose inflammation. However, the molecular mechanisms behind these beneficial effects are poorly understood.

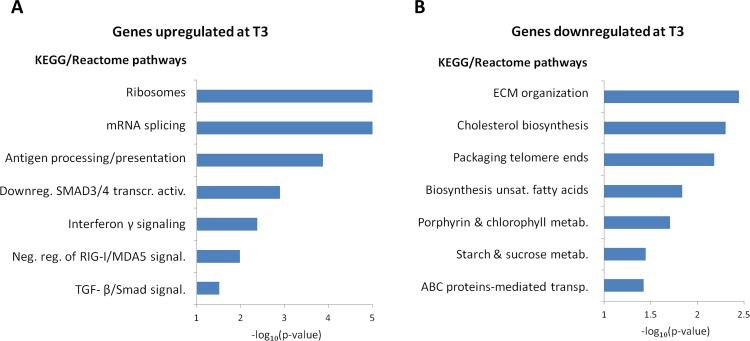
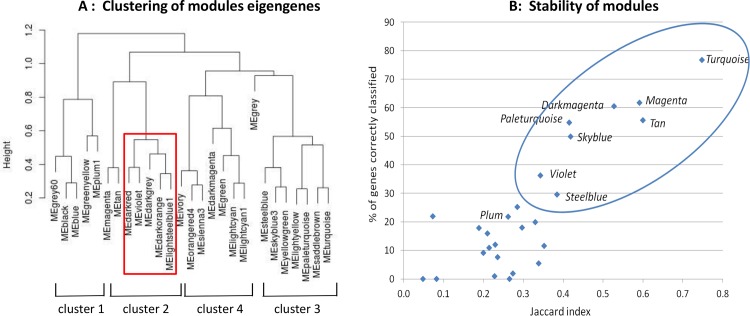
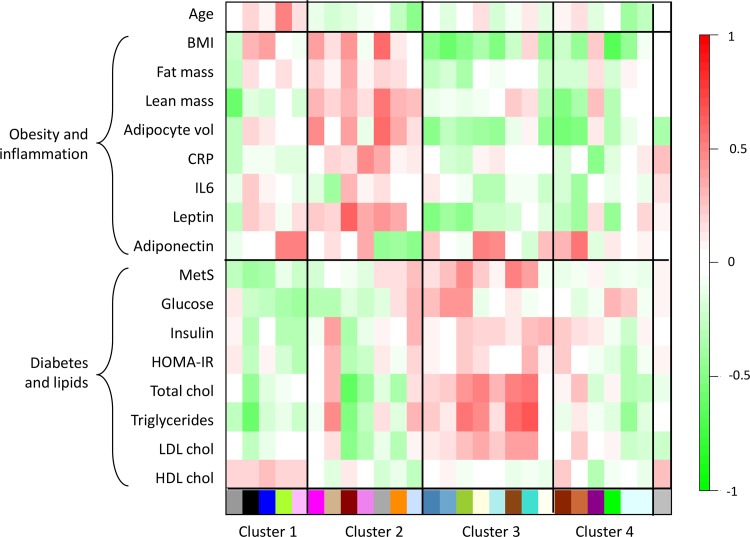
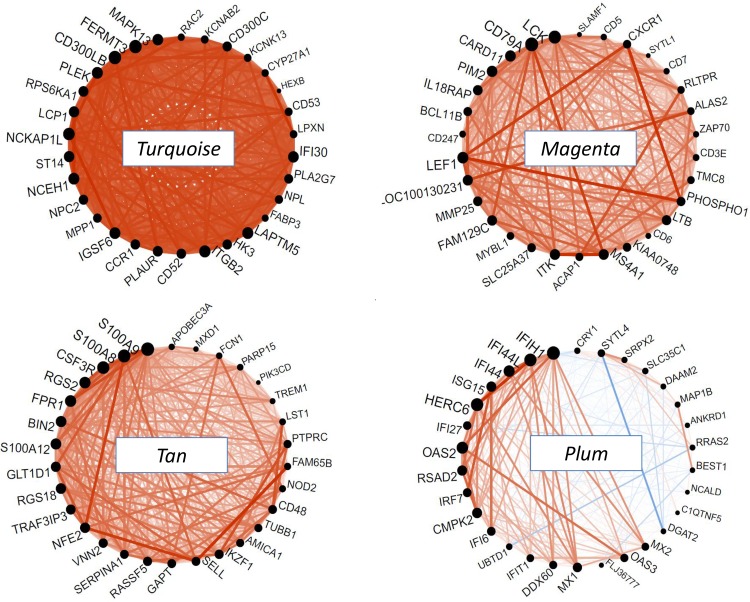
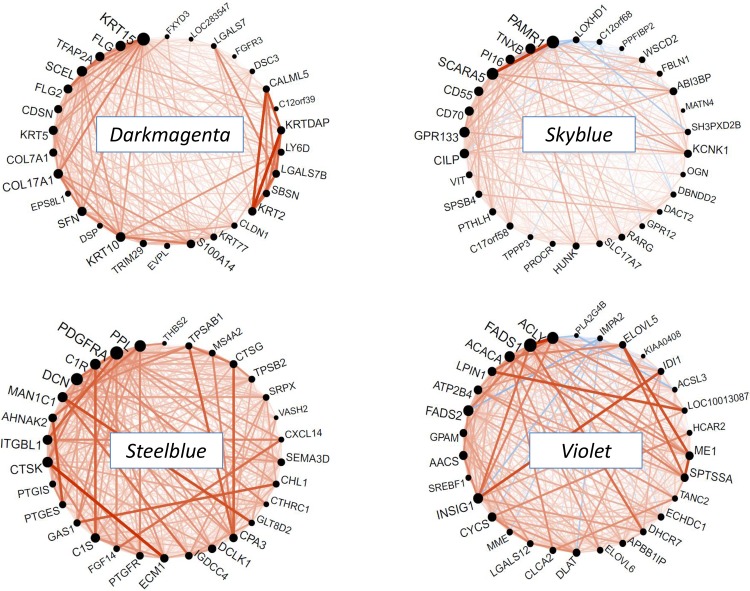
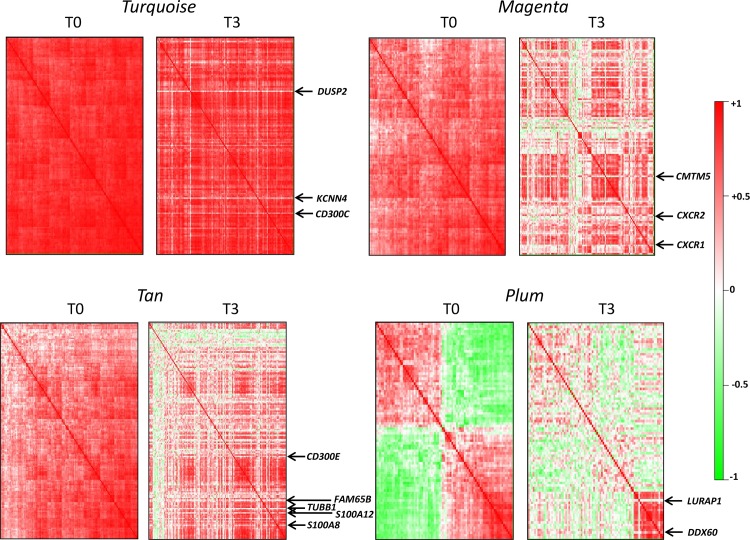
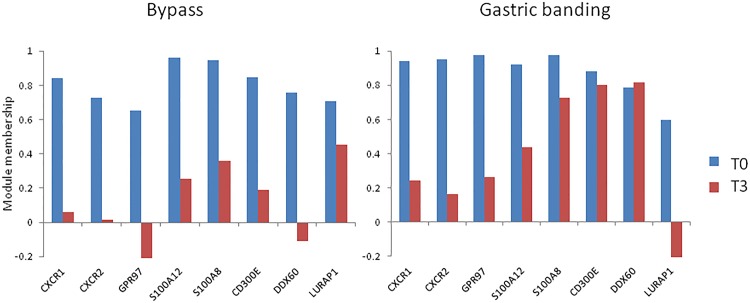
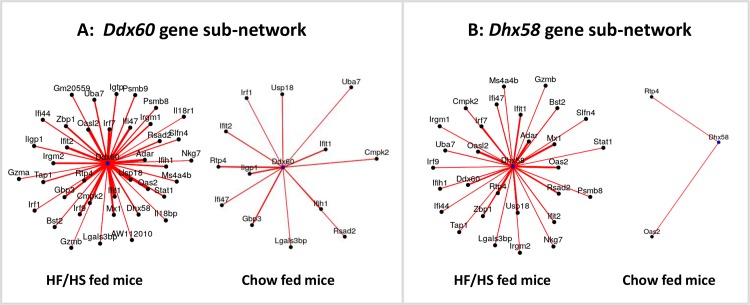
Methodology/principal findings: We analyzed RNA-seq expression profiles in adipose tissue from 22 obese women before and 3 months after surgery. Of 15,972 detected genes, 1214 were differentially expressed after surgery at a 5% false discovery rate. Upregulated genes were mostly involved in the basal cellular machinery. Downregulated genes were enriched in metabolic functions of adipose tissue. At baseline, 26 modules of coexpressed genes were identified. The four most stable modules reflected the innate and adaptive immune responses of adipose tissue. A first module reflecting a non-specific signature of innate immune cells, mainly macrophages, was highly conserved after surgery with the exception of DUSP2 and CD300C. A second module reflected the adaptive immune response elicited by T lymphocytes; after surgery, a disconnection was observed between genes involved in T-cell signaling and mediators of the signal transduction such as CXCR1, CXCR2, GPR97, CCR7 and IL7R. A third module reflected neutrophil-mediated inflammation; after surgery, several genes were dissociated from the module, including S100A8, S100A12, CD300E, VNN2, TUBB1 and FAM65B. We also identified a dense network of 19 genes involved in the interferon-signaling pathway which was strongly preserved after surgery, with the exception of DDX60, an antiviral factor involved in RIG-I-mediated interferon signaling. A similar loss of connection was observed in lean mice compared to their obese counterparts.

Conclusions/significance: These results suggest that improvements of the inflammatory state following surgery might be explained by a disruption of immuno-inflammatory cascades involving a few crucial molecules which could serve as potential therapeutic targets.


Conflict of interest statement

Competing Interests: The authors have declared that no competing interests exist.

Figures

Fig 1
Fig 1. Pathways enriched in genes upregulated (A) and downregulated (B) after surgery-induced weight loss.
The x axis indicates the significance of the GSEA score test for enrichment in the given pathway.
Fig 2
Fig 2. Gene coexpression networks at baseline identified by WGCNA.
(A) Hierarchical clustering of module eigengenes. The open red square indicates the 5 modules with the highest proportions of differentially expressed genes (>20%). (B) Stability of modules by Jackknife analysis. The x axis indicates the mean Jaccard index and the y axis the proportion of genes correctly classified (i.e. attributed to the proper module in ≥ 18 out of 22 sub-analyses). The ellipse surrounds the most stable modules.
Fig 3
Fig 3. Correlations between module eigengenes and patient's characteristics at baseline.
Clinical and biological traits (rows) were regrouped in 2 categories (obesity and inflammation-related traits, glucose and lipid homeostasis-related traits). Module eigengenes (columns) were clustered as in Fig 2. In the heatmap, red color represents positive correlation and green color negative correlation.
Fig 4
Fig 4. Network circle plots of immune-response modules at baseline.
The figure depicts the connectivity patterns between the top 30 hubgenes of each module. Genes are ranked in the anticlockwise direction according to decreasing module membership. The size of each black circle indicates the gene connectivity (number of connected genes). An orange line indicates a positive correlation and a blue line a negative correlation between any 2 genes. The turquoise module reflects a general immune response, the magenta module reflects lymphocyte activation, the tan module reflects neutrophil activation and the plum module reflects the interferon signaling pathway.
Fig 5
Fig 5. Network circle plots of other modules at baseline.
See legend of Fig 4. The darkmagenta reflects ectoderm, the skyblue and steelblue modules reflect the extracellular matrix and the violet module reflect lipid metabolism.
Fig 6
Fig 6. Modifications of immune-response networks after surgery-induced weight loss.
Heatmaps representing pairwise correlation matrices of gene expressions are displayed for each module. At T3, genes are ranked in the same order as in T0. Only genes having the highest membership to each module are displayed, except for the plum module where all genes are shown.
Fig 7
Fig 7. Module membership of some genes of interest before (T0) and after surgery (T3), separately in RYGB and AGB.
The module membership of a gene represents the correlation to its module eigengene. For each module, the eigengene at T3 was calculated on the same gene set as at T0.
Fig 8
Fig 8. Sub-networks of expression around Ddx60 and Dhx58 genes in obese versus lean mice.
Comparison of obese mice fed a high-fat/high-sucrose (HF/HS) diet and lean mice fed a chow diet (microarray data). Only edges corresponding to significant correlations are shown (P<0.05 and cor>0.4). The thicker and shorter edges correspond to stronger correlations. Networks were visualized using the gplot function of the sna R package.

References

    1. Ng M, Fleming T, Robinson M, Thomson B, Graetz N, Margono C, et al. Global, regional, and national prevalence of overweight and obesity in children and adults during 1980–2013: a systematic analysis for the Global Burden of Disease Study 2013. Lancet 2014; 384:766–781. 10.1016/S0140-6736(14)60460-8 - DOI - PMC - PubMed
    1. Mraz M, Haluzik M. The role of adipose tissue immune cells in obesity and low-grade inflammation. J Endocrinol. 2014; 222:R113–127. 10.1530/JOE-14-0283 - DOI - PubMed
    1. Ferrante AW Jr. The immune cells in adipose tissue. Diabetes Obes Metab. 2013; 15 Suppl 3:34–38. 10.1111/dom.12154 - DOI - PMC - PubMed
    1. Schauer PR, Bhatt DL, Kirwan JP, Wolski K, Brethauer SA, Navaneethan SD, et al. Bariatric surgery versus intensive medical therapy for diabetes—3-year outcomes. N Engl J Med. 2014; 370:2002–2013. 10.1056/NEJMoa1401329 - DOI - PMC - PubMed
    1. Zhang H, Wang Y, Zhang J, Potter BJ, Sowers JR, Zhang C. Bariatric surgery reduces visceral adipose inflammation and improves endothelial function in type 2 diabetic mice. Arterioscler Thromb Vasc Biol. 2011; 31:2063–2069. 10.1161/ATVBAHA.111.225870 - DOI - PMC - PubMed

Publication types

MeSH terms

Associated data