. 2015 May 4;10(5):e0124122.
doi: 10.1371/journal.pone.0124122. eCollection 2015.

Dynamics of influenza seasonality at sub-regional levels in India and implications for vaccination timing

Affiliations

Dynamics of influenza seasonality at sub-regional levels in India and implications for vaccination timing

Mandeep S Chadha et al. PLoS One. .

Abstract

Background: Influenza surveillance is an important tool to identify emerging/reemerging strains, and defining seasonality. We describe the distinct patterns of circulating strains of the virus in different areas in India from 2009 to 2013.

Methods: Patients in ten cities presenting with influenza like illness in out-patient departments of dispensaries/hospitals and hospitalized patients with severe acute respiratory infections were enrolled. Nasopharangeal swabs were tested for influenza viruses by real-time RT-PCR, and subtyping; antigenic and genetic analysis were carried out using standard assays.

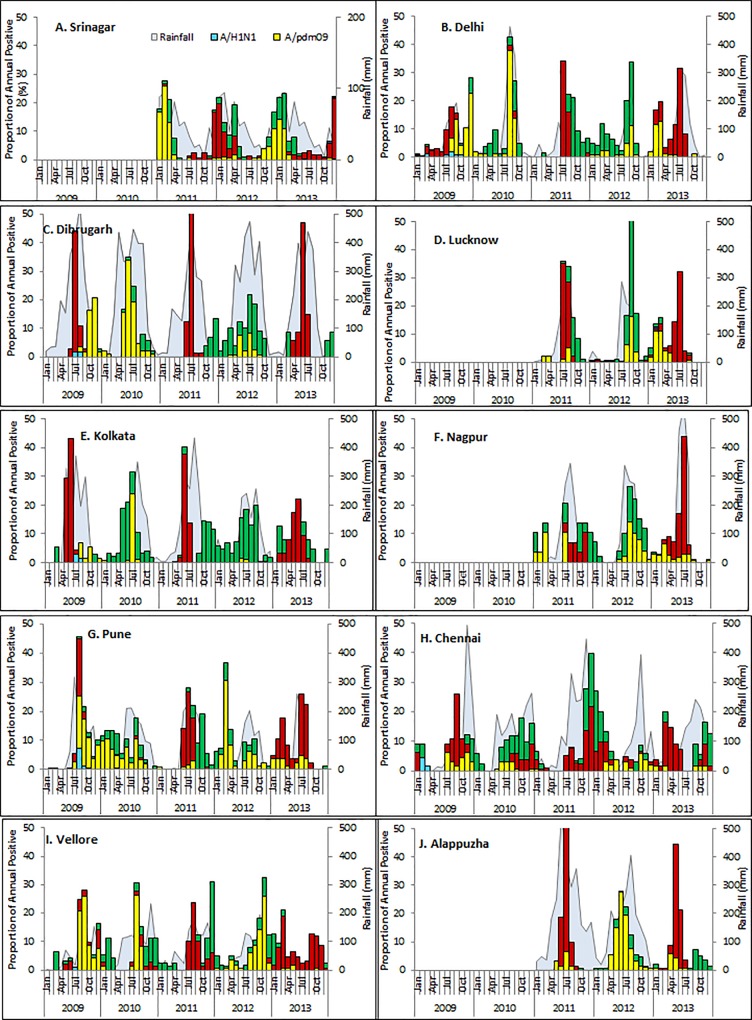
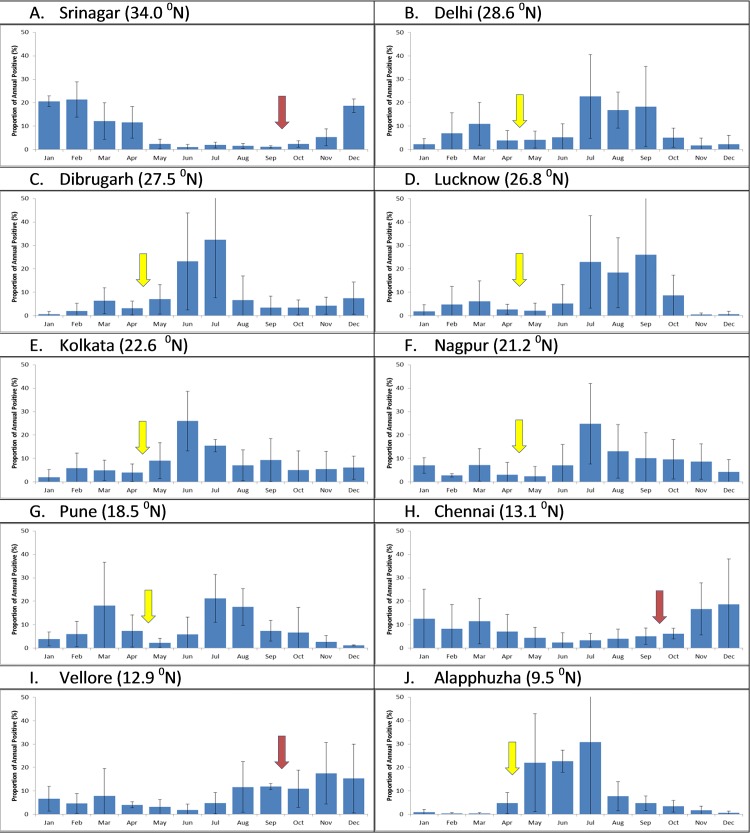
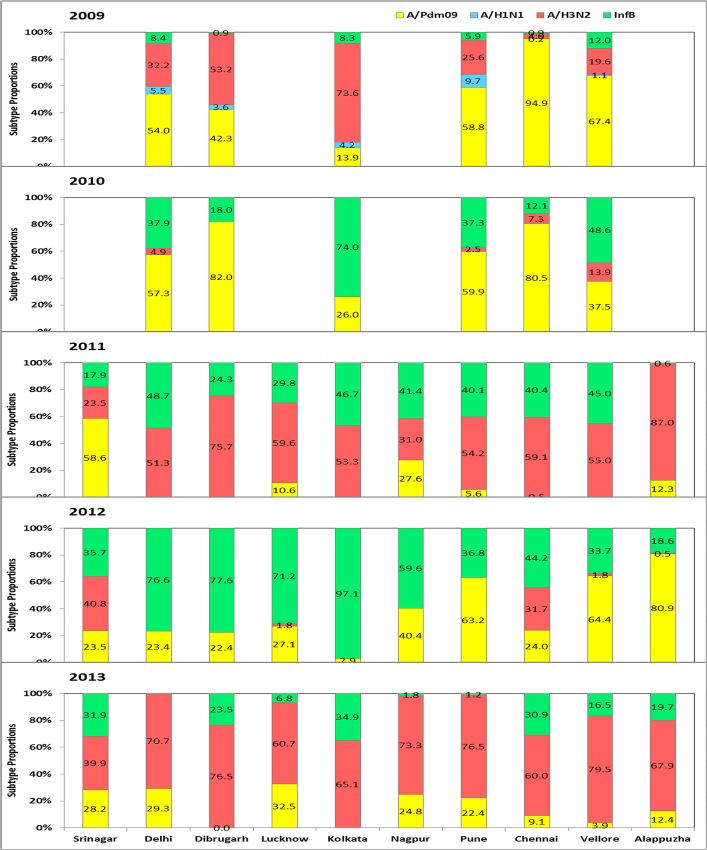
Results: Of the 44,127 ILI/SARI cases, 6,193 (14.0%) were positive for influenza virus. Peaks of influenza were observed during July-September coinciding with monsoon in cities Delhi and Lucknow (north), Pune (west), Allaphuza (southwest), Nagpur (central), Kolkata (east) and Dibrugarh (northeast), whereas Chennai and Vellore (southeast) revealed peaks in October-November, coinciding with the monsoon months in these cities. In Srinagar (Northern most city at 34°N latitude) influenza circulation peaked in January-March in winter months. The patterns of circulating strains varied over the years: whereas A/H1N1pdm09 and type B co-circulated in 2009 and 2010, H3N2 was the predominant circulating strain in 2011, followed by circulation of A/H1N1pdm09 and influenza B in 2012 and return of A/H3N2 in 2013. Antigenic analysis revealed that most circulating viruses were close to vaccine selected viral strains.

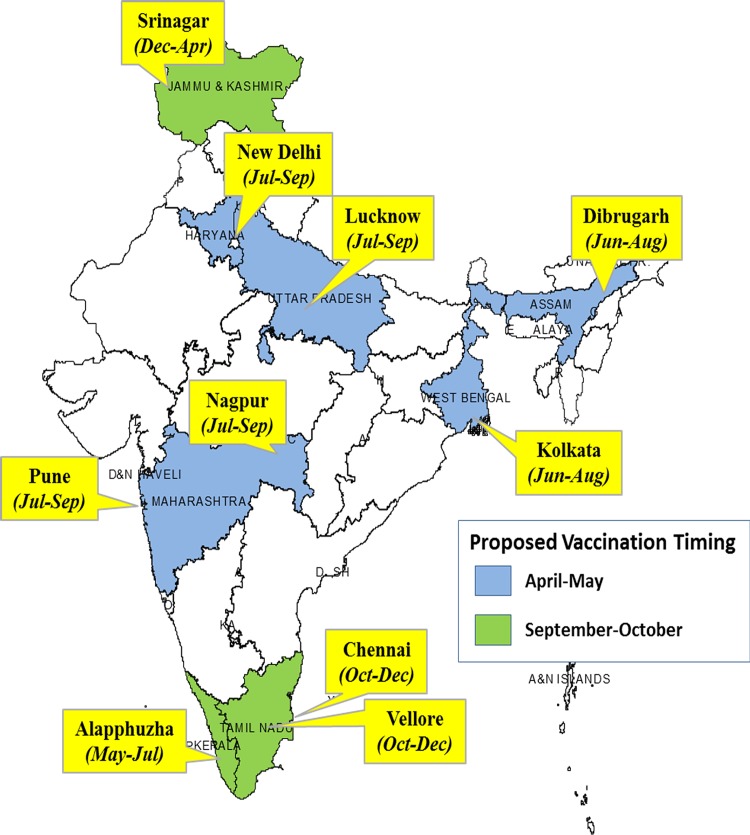
Conclusions: Our data shows that India, though physically located in northern hemisphere, has distinct seasonality that might be related to latitude and environmental factors. While cities with temperate seasonality will benefit from vaccination in September-October, cities with peaks in the monsoon season in July-September will benefit from vaccination in April-May. Continued surveillance is critical to understand regional differences in influenza seasonality at regional and sub-regional level, especially in countries with large latitude span.


Conflict of interest statement

Competing Interests: The authors have declared that no competing interests exist.

Figures

Fig 1
Fig 1. Monthly trends and seasonality of circulating influenza viruses in India, 2009–2013.
Data is shown for Srinagar (A), Delhi (B), Dibrugarh (C), Lucknow (D),Kolkata (E), Nagpur (F), Pune (G), Chennai (H), Vellore (I), and Alappuzha (J). The left axis shows the proportion positive for influenza A/H1N1 (blue), A/H1N1pdm09 (yellow), A/H3N2 (red) and influenza B (green). The total number of influenza positives in a year were considered as 100%, and the percent positivity for each month was calculated for each year. Rainfall is shown in the background.
Fig 2
Fig 2. The proportion of influenza virus positivity by year (2009–2013) in India.
Cumulative data on monthly distribution of influenza viruses by city was calculated (data shown is Mean± 1 SE). For this analysis, data from 2009–2010 was excluded due to the pandemic which did not follow the usual seasonality pattern. Arrow indicates proposed vaccination timing during September-October (red arrow) or April-May (yellow arrow). The latitude for the capital city of each country is shown on the top of each panel.
Fig 3
Fig 3. Influenza virus type and subtype distribution by year and city.
The overall % positivity of types and subtypes is shown for each city. The left axis shows the percent monthly distribution of seasonal influenza A/H1 (blue); A/H3 (red), influenza B (green) and pandemic A/H1N1pdm09 (yellow) from 2009 to 2013.
Fig 4
Fig 4. Peak influenza circulation based on seasons in India.
Flags show names of the city, and peaks months of influenza circulation. India map is color coded for states with proposed vaccination timing with blue color for April-May and green color used for September-October.

References

    1. Simonsen L. The global impact of influenza on morbidity and mortality. Vaccine. 1999;17 Suppl 1:S3–10. Epub 1999/09/02. PubMed . - PubMed
    1. Mathews JD, Chesson JM, McCaw JM, McVernon J. Understanding influenza transmission, immunity and pandemic threats. Influenza and other respiratory viruses. 2009;3(4):143–9. Epub 2009/07/25. 10.1111/j.1750-2659.2009.00089.x PubMed . - DOI - PMC - PubMed
    1. Azziz Baumgartner E, Dao CN, Nasreen S, Bhuiyan MU, Mah EMS, Al Mamun A, et al. Seasonality, timing, and climate drivers of influenza activity worldwide. The Journal of infectious diseases. 2012;206(6):838–46. Epub 2012/07/26. 10.1093/infdis/jis467 PubMed . - DOI - PubMed
    1. Tamerius J, Nelson MI, Zhou SZ, Viboud C, Miller MA, Alonso WJ. Global influenza seasonality: reconciling patterns across temperate and tropical regions. Environmental health perspectives. 2011;119(4):439–45. Epub 2010/11/26. 10.1289/ehp.1002383 PubMed - DOI - PMC - PubMed
    1. Park AW, Glass K. Dynamic patterns of avian and human influenza in east and southeast Asia. The Lancet infectious diseases. 2007;7(8):543–8. Epub 2007/07/25. 10.1016/S1473-3099(07)70186-X PubMed . - DOI - PubMed

Publication types