. 2015 Jun 20;6(17):15008-21.
doi: 10.18632/oncotarget.3634.

PARP inhibitor ABT-888 affects response of MDA-MB-231 cells to doxorubicin treatment, targeting Snail expression

Affiliations

PARP inhibitor ABT-888 affects response of MDA-MB-231 cells to doxorubicin treatment, targeting Snail expression

Germano Mariano et al. Oncotarget. .

Abstract

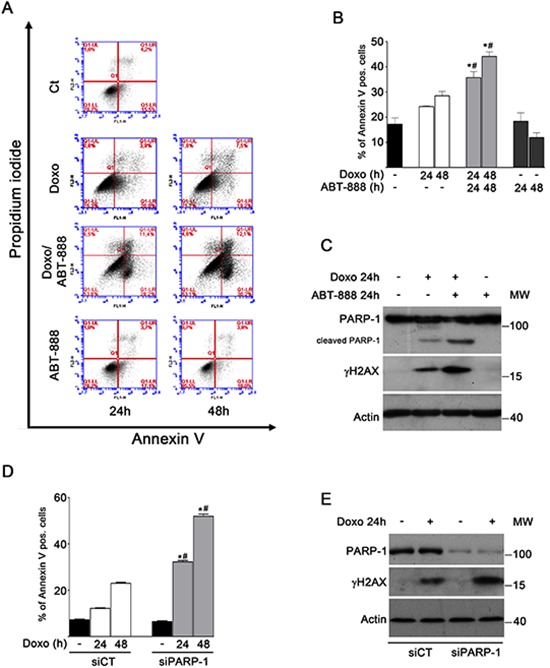
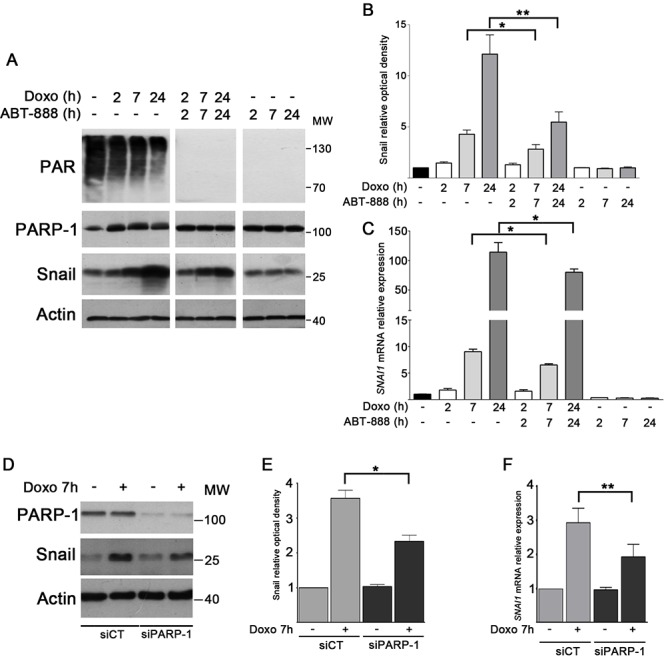
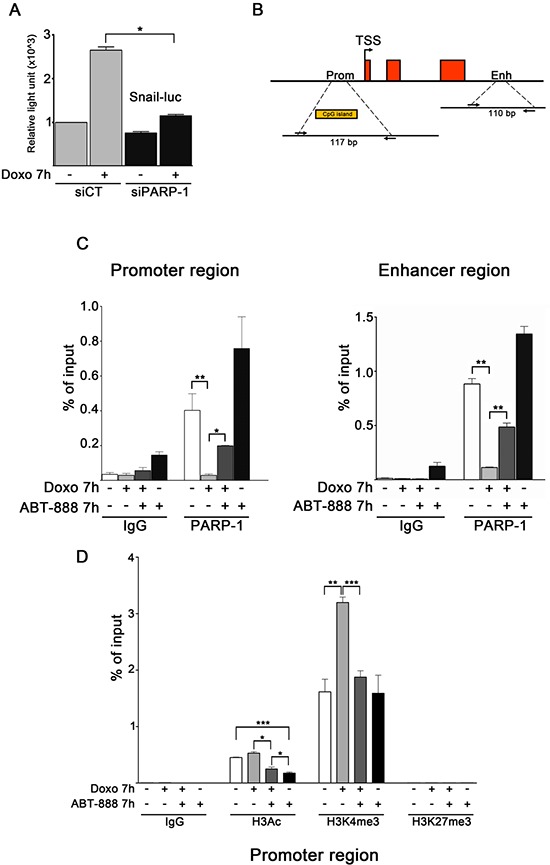
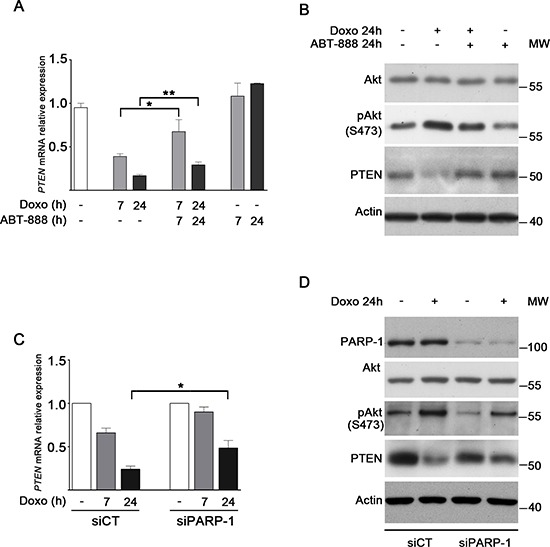
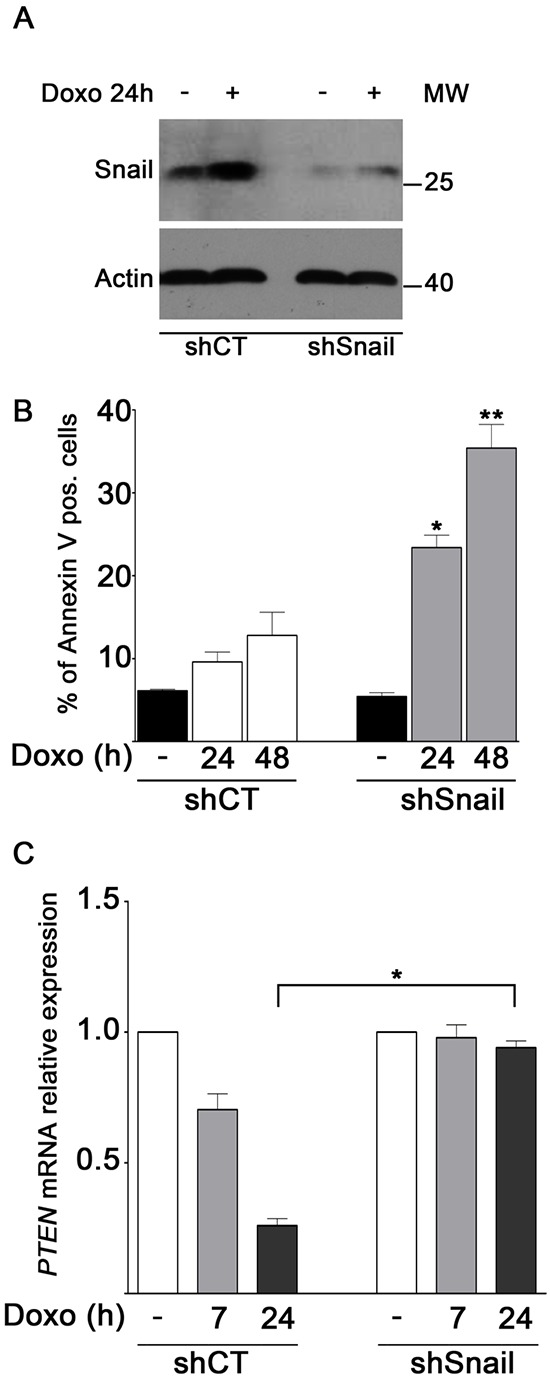
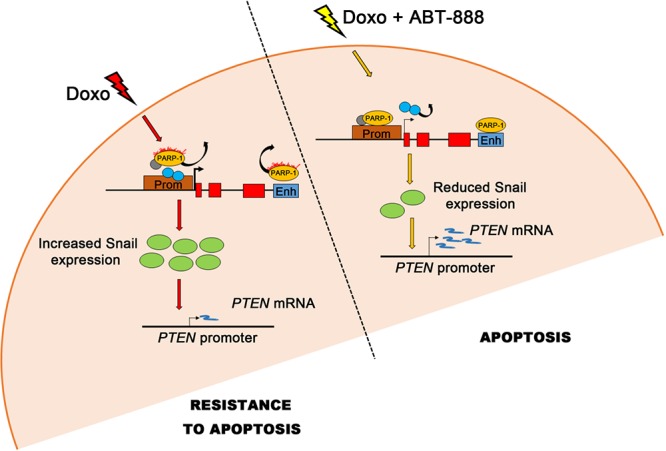
To overcome cancer cells resistance to pharmacological therapy, the development of new therapeutic approaches becomes urgent. For this purpose, the use of poly(ADP-ribose) polymerase (PARP) inhibitors in combination with other cytotoxic agents could represent an efficacious strategy. Poly(ADP-ribosyl)ation (PARylation) is a post-translational modification that plays a well characterized role in the cellular decisions of life and death. Recent findings indicate that PARP-1 may control the expression of Snail, the master gene of epithelial-mesenchymal transition (EMT). Snail is highly represented in different resistant tumors, functioning as a factor regulating anti-apoptotic programmes. MDA-MB-231 is a Snail-expressing metastatic breast cancer cell line, which exhibits chemoresistance properties when treated with damaging agents. In this study, we show that the PARP inhibitor ABT-888 was capable to modulate the MDA-MB-231 cell response to doxorubicin, leading to an increase in the rate of apoptosis. Our further results indicate that PARP-1 controlled Snail expression at transcriptional level in cells exposed to doxorubicin. Given the increasing interest in the employment of PARP inhibitors as chemotherapeutic adjuvants, our in vitro results suggest that one of the mechanisms through which PARP inhibition can chemosensitize cancer cells in vivo, is targeting Snail expression thus promoting apoptosis.

Keywords: PARP inhibitors; Snail; breast cancer; chemoresistance.


Conflict of interest statement

CONFLICTS OF INTEREST

The authors declare that there are no conflicts of interest.

Figures

FIGURE 1
FIGURE 1. ABT-888 treatment and PARP-1 depletion sensitize MDA-MB-231 cells to doxo-induced apoptosis
A. Apoptosis was analysed by FACS after treatment of MDA-MB-231 cells with 1 μM doxo and/or 0.5 μM ABT-888 for 24 and 48 h. Panels of a representative experiment are shown. B. Annexin V positive cells were counted in the right upper and lower squares. The diagram reports the percentage of Annexin V positive cells in untreated cells (black bar) and after treatment with 1 μM doxo (white bars), 1 μM doxo plus 0.5 μM ABT-888 (light gray bars) or ABT-888 alone (dark gray bars) at the indicated times in relation to total cells. Data represented are the mean+SEM of at least three independent experiments performed in duplicates. Comparisons were made with ANOVA/Turkey's test. *P < 0.05 compared to untreated cells; #P < 0.05 compared to cells treated with doxo at 24 h, 48 h respectively. C. Levels of cleaved PARP-1 (detected with mAb clone C2-10, Enzo Life Sciences) and γH2AX protein were measured by Western blot analyses in MDA-MB-231 cells treated for 24 h with 1 μM doxo and/or 0.5 μM ABT-888. D. Annexin V positive cells were counted in the right upper and lower squares. The diagram reports the percentage of Annexin V positive cells in siCT cells untreated (black bar) or treated with doxo (white bars) and in siPARP-1 cells untreated (black bar) or treated with doxo (light gray bars). Comparisons were made with ANOVA/Turkey's test. *P < 0.05 compared to untreated cell; #P < 0.05 compared to cells treated with doxo at 24 h, 48 h respectively. E. Levels of PARP-1 and γH2AX protein were measured by Western blot analyses in siCT MDA-MB-231 cells and in siPARP-1 MDA-MB-231cells treated for 24 h with 1 μM doxo.
FIGURE 2
FIGURE 2. PARP-1 activity is required for Snail upregulation in doxo-treated MDA-MB-231 cells
MDA-MB-231 cells were treated with 1 μM doxo, 1 μM doxo plus 0.5 μM ABT-888, 0.5 μM ABT-888 alone at the indicated times. A. PAR, PARP-1 (detected with mAb clone F1–23 Enzo Life Sciences) and Snail levels were assessed by Western blot analysis B. Graph shows the average densitometry of Snail values normalized to actin, considering Snail level in untreated cells as 1.0. Data represent mean + SEM of three independent experiments. *P < 0.05, **P < 0.01 by Student's t-test. C. Expression levels of SNAI1 mRNA were assessed by Real-Time PCR after 2 h (white bars), 7 h (light gray bars) and 24 h (dark gray bars) of treatment and compared to untreated cells (black bar) considered as 1.0. Data represent mean + SEM of at least five independent experiments performed in triplicates. *P < 0.05, **P < 0.01 by Students t-test. D. Snail protein level was assessed by Western blot in MDA-MB-231 cells silenced for PARP-1 after treatment with 1 μM doxo for 7 h. E. Graph shows the average densitometry of Snail values normalized to actin, considering Snail level in untreated cells as 1.0. Data represent mean + SEM of three independent experiments. *P < 0.05 by Student's t-test. F. Levels of SNAI1mRNA in MDA-MB-231 cells silenced for PARP-1 (dark gray bars) after treatment with 1 μM doxo for 7 h in relation with cells transfected with siCT (light gray bars). Data represent mean + SEM of three independent experiments performed in triplicates. **P < 0.01 by Student's t-test.
FIGURE 3
FIGURE 3. PARP activity affects PARP-1 binding and histone H3 modifications profiles at SNAI1 locus in doxo-exposed MDA-MB-231 cells
A. Dual-luciferase assay of MDA-MB-231 cells transfected with a Snail reporter plasmid and siRNA to knockdown PARP-1. Results are presented as variation of light units measured in siCT cells (light gray bars) exposed to doxo and in untreated and doxo-exposed siPARP-1 cells (black bars) relatively to the activity of siCT untreated cells, set as 1.0. Data (mean and SEM) are representative of at least three independent experiments. *P < 0.05 by Student's t-test. B. Schematic view of the human SNAI1 gene, comprised of three exons. Among the regulatory elements, a CpG island in the promoter region and an enhancer, corresponding to a DNase hypersensitive site, are highly conserved. The position of the primers pair used to amplify the indicated sequence of the promoter region (length 117bp) and enhancer region (length 110bp) are reported. C. MDA-MB-231 cells, treated for 7 hours with 1 μM doxo, 0.5 μM ABT-888, 1 μM doxo plus 0.5 μM ABT-888, were fixed and lysed. ChIP assays for PARP-1 were conducted and DNA isolated from PARP-1 IPs was used in Real-Time PCR to amplify the indicated genomic loci on promoter (left panel) and on enhancer (right panel). DNA coprecipitated with control IgG was also amplified to control aspecific signal. D. MDA-MB-231 cells, treated for 7 hours with 1 μM doxo, 0.5 μM ABT-888, 1 μM doxo plus 0.5 μM ABT-888, were fixed and lysed ChIP assays for H3Ac, H3K4me3 and H3K27me3 were conducted. DNA was isolated from IPs and used in Real-Time PCR to amplify the indicated genomic locus on SNAI1 promoter. DNA coprecipitated with control IgG was also amplified to control aspecific signal. Each experiment of Real-Time PCR was conducted in triplicates and depicted as the average of immunoprecipitated signal to input signal and SEM. Data represent averages of three experiments.*P < 0.05, **P < 0.01, ***P < 0.001 by Students t-test.
FIGURE 4
FIGURE 4. PARP-1 inhibition/depletion antagonizes doxo-induced downregulation of PTEN in MDA-MB-231 cells and decreases Akt activity
A. Expression levels of PTEN after treatment with 1 μM doxo, 1 μM doxo plus 0.5 μM ABT-888 or ABT-888 for 7 h (light gray bars) or 24 h (dark gray bars) in relation to untreated cells (white bar), considered as 1.0. Data represent mean+SEM of at least five independent experiments performed in triplicates. *P < 0.05, **P < 0.01 by Student's t-test. B. Levels of Akt, phospho-Akt, PTEN and γH2AX protein were measured by Western blot analyses in MDA-MB-231 cells treated for 24 h with 1 μM doxo and/or 0.5 μM ABT-888 as indicated. C. Expression levels of PTEN after treatment of siCT and siPARP-1 MDA-MB-231 cells with 1 μM doxo for 7 h (light gray bars) or 24 h (dark gray bars) in relation to untreated siCT and siPARP-1 cells (white bars), considered as 1.0. Data represent mean+SEM of three independent experiments performed in triplicates. *P < 0.05 by Student's t-test. D. Levels of PARP-1, Akt, phospho-Akt, and PTEN protein were measured by Western blot analyses in siCT and siPARP-1 MDA-MB-231 cells treated for 24 h with 1 μM doxo.
FIGURE 5
FIGURE 5. Snail knockdown sensitizes MDA-MB-231 cells to doxo-induced apoptosis and allows recovery of PTEN expression
A. Levels of Snail protein were measured by Western blot analyses in shCT and shSnail MDA-MB-231 cells treated for 24 h with 1 μM doxo B. Annexin V positive cells were counted in the right upper and lower squares. The diagram reports the percentage of Annexin V positive cells in untreated shCT and shSnail cells (black bars) and after treatment of shCT (white bars) and shSnail cells (light gray bars) with 1 μM doxo at the indicated times in relation to total cells. Data represented are the mean+SEM of three independent experiments performed in duplicates. Comparisons were made with ANOVA/Turkey's test. *P < 0.05, **P < 0.01 compared to cells treated with doxo at 24 h, 48 h respectively. C. Expression levels of PTEN after treatment of shCT and shSnail MDA-MB-231 cells with 1 μM doxo for 7 h (light gray bars) or 24 h (dark gray bars) in relation to untreated shCT and shSnail cells (white bars), considered as 1.0. Data represent mean+SEM of three independent experiments performed in triplicates. *P < 0.05 by Student's t-test.
FIGURE 6
FIGURE 6. Model of Snail transcriptional regulation by PARP-1 and effect of the differential Snail expression on apoptosis in MDA-MB-231 cells
The presence or absence of PARP-1 on the SNAI1 promoter/enhancer, which depends on the rate of PARP activity, affects the activity of SNAI1 promoter (see Discussion). After the doxorubicin treatment (left side), PARP activity increases and PARP-1 detaches from DNA probably bringing away repressive factors (gray circle) from the promoter while other positive transcription factors (blue circles) may bind it. This event causes a strong increase in Snail transcription (green circles) and the consequent repression of its target gene PTEN which results in resistance to apoptosis. After the treatment with doxo/ABT-888 (right side), PARP activity decreases and PARP-1 can bind the SNAI1 promoter/enhancer possibly causing the release of positive transcription factors from the promoter (light blue circles). The Snail transcription is lower, leading to a less efficacious repression of Snail on PTEN transcription and to a significant recovery of the apoptotic process.

References

    1. Rebucci M, Michiels C. Molecular aspects of cancer cell resistance to chemotherapy. Biochemical pharmacology. 2013;85:1219–1226. - PubMed
    1. Videira M, Reis RL, Brito MA. Deconstructing breast cancer cell biology and the mechanisms of multidrug resistance. Biochimica et biophysica acta. 2014;1846:312–325. - PubMed
    1. Chen DR, Lu DY, Lin HY, Yeh WL. Mesenchymal stem cell-induced doxorubicin resistance in triple negative breast cancer. BioMed research international. 2014;2014:532161. - PMC - PubMed
    1. Thiery JP, Acloque H, Huang RY, Nieto MA. Epithelial-mesenchymal transitions in development and disease. Cell. 2009;139:871–890. - PubMed
    1. de Herreros AG, Peiro S, Nassour M, Savagner P. Snail family regulation and epithelial mesenchymal transitions in breast cancer progression. Journal of mammary gland biology and neoplasia. 2010;15:135–147. - PMC - PubMed

Publication types

MeSH terms