. 2015 May 4;10(5):e0126194.
doi: 10.1371/journal.pone.0126194. eCollection 2015.

Nicotinamide impairs entry into and exit from meiosis I in mouse oocytes

Affiliations

Nicotinamide impairs entry into and exit from meiosis I in mouse oocytes

Angelique Riepsamen et al. PLoS One. .

Erratum in

Abstract

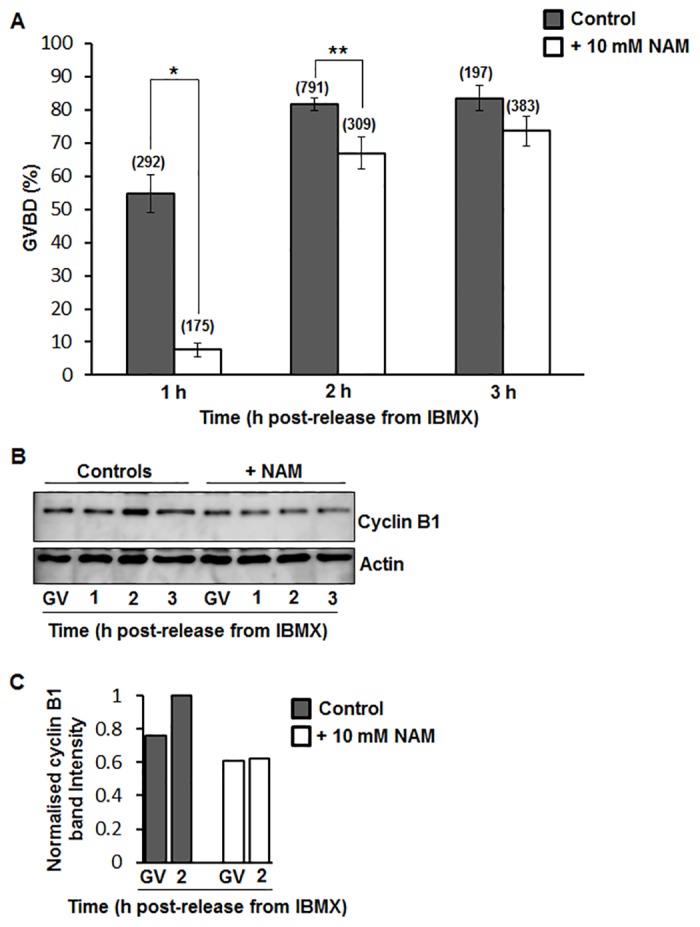
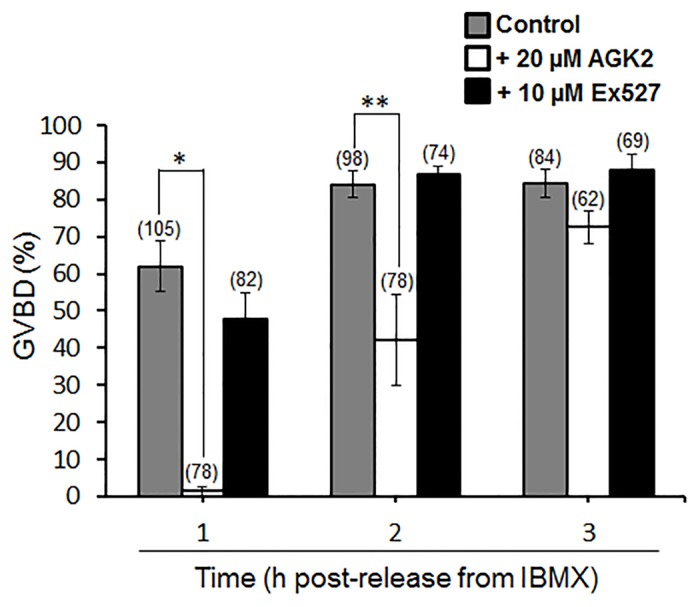
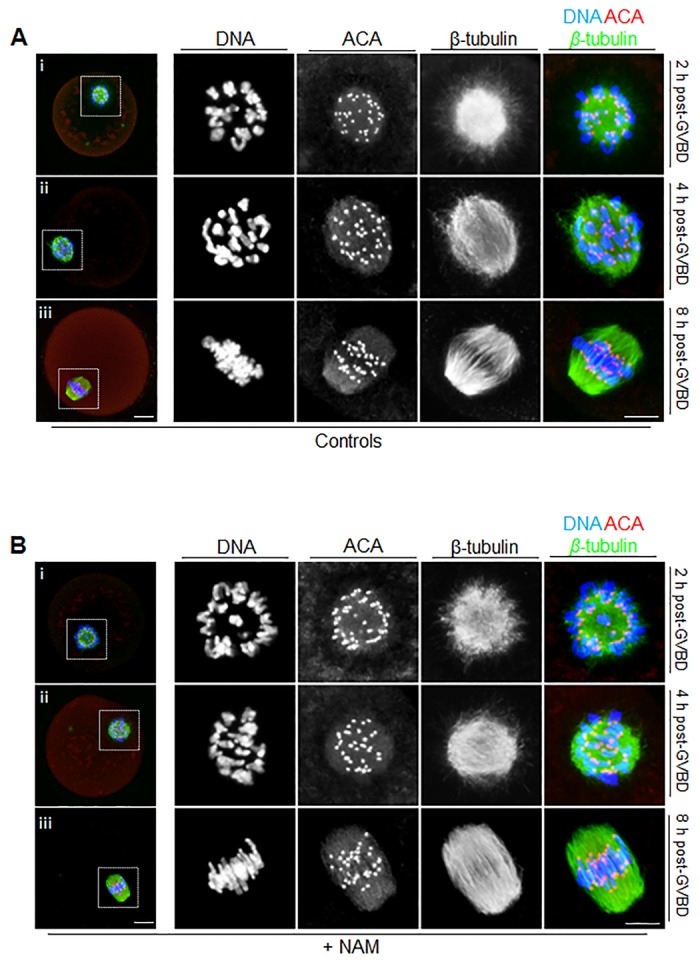
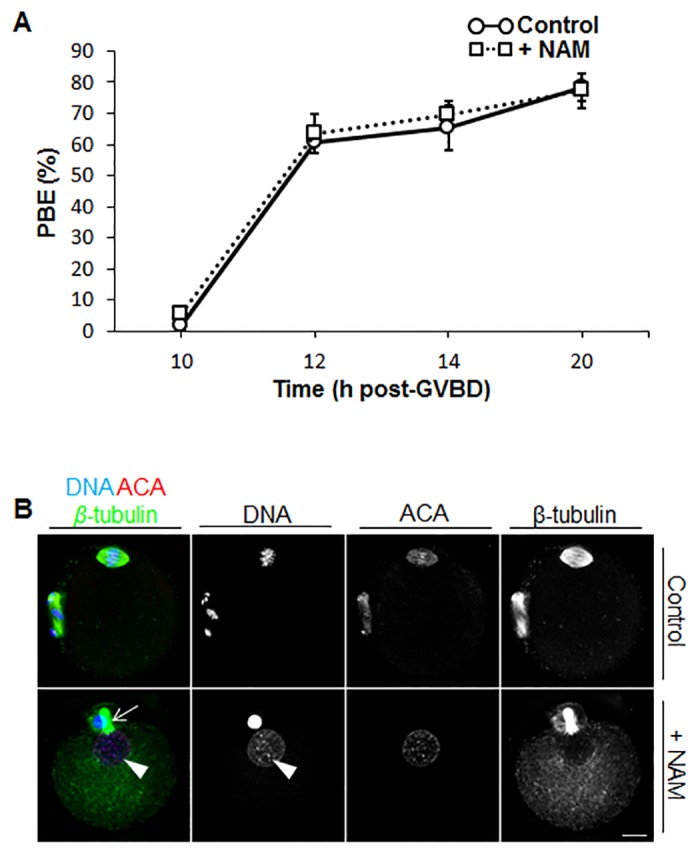
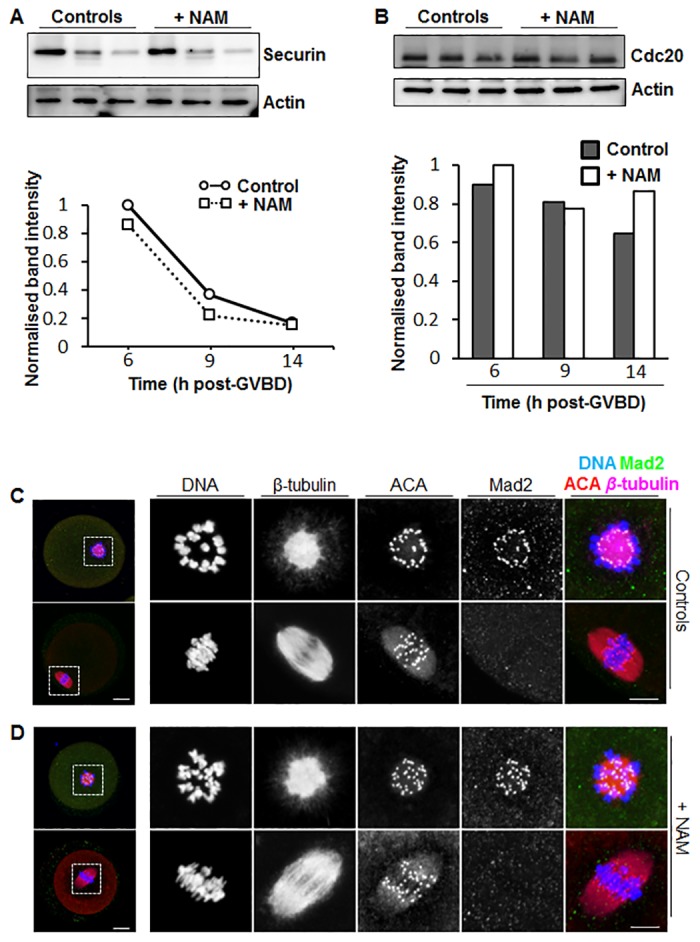
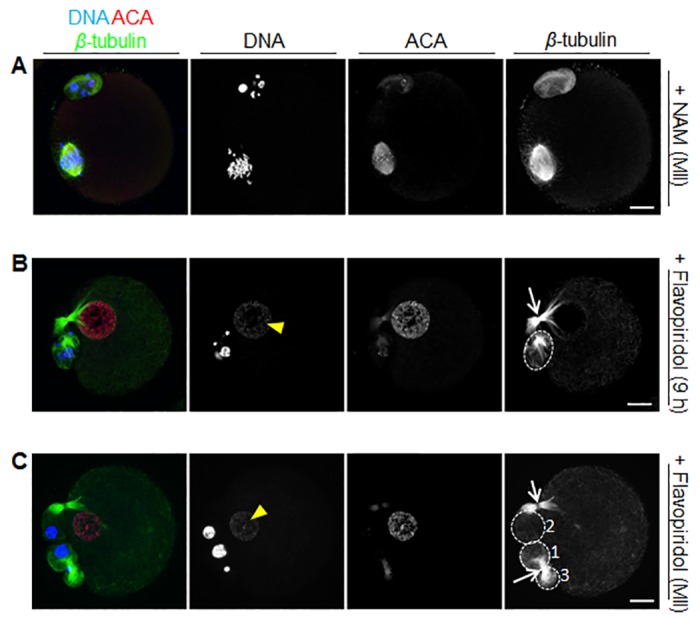
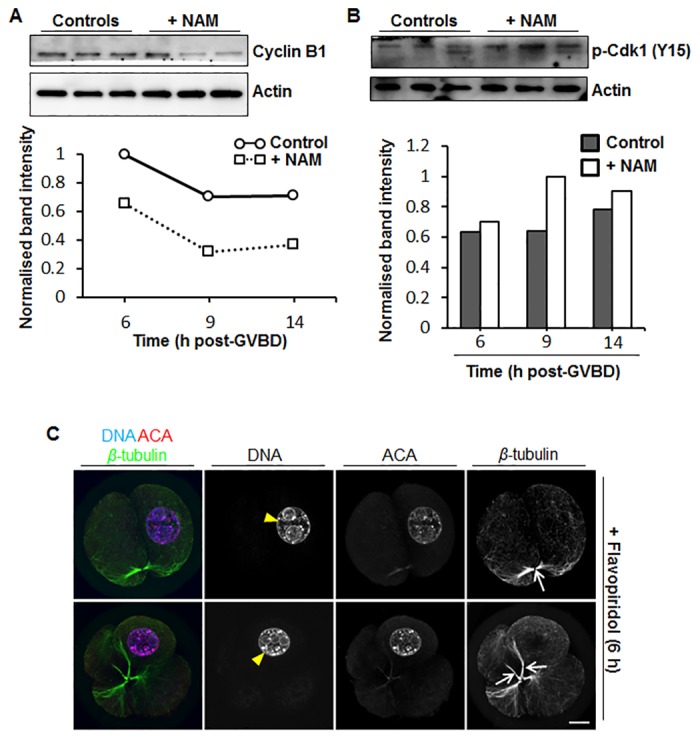
Following exit from meiosis I, mammalian oocytes immediately enter meiosis II without an intervening interphase, accompanied by rapid reassembly of a bipolar spindle that maintains condensed chromosomes in a metaphase configuration (metaphase II arrest). Here we study the effect of nicotinamide (NAM), a non-competitive pan-sirtuin inhibitor, during meiotic maturation in mouse oocytes. Sirtuins are a family of seven NAD+-dependent deacetylases (Sirt1-7), which are involved in multiple cellular processes and are emerging as important regulators in oocytes and embryos. We found that NAM significantly delayed entry into meiosis I associated with delayed accumulation of the Cdk1 co-activator, cyclin B1. GVBD was also inhibited by the Sirt2-specific inhibitor, AGK2, and in a very similar pattern to NAM, supporting the notion that as in somatic cells, NAM inhibits sirtuins in oocytes. NAM did not affect subsequent spindle assembly, chromosome alignment or the timing of first polar body extrusion (PBE). Unexpectedly, however, in the majority of oocytes with a polar body, chromatin was decondensed and a nuclear structure was present. An identical phenotype was observed when flavopiridol was used to induce Cdk1 inactivation during late meiosis I prior to PBE, but not if Cdk1 was inactivated after PBE when metaphase II arrest was already established, altogether indicating that NAM impaired establishment rather than maintenance of metaphase II arrest. During meiosis I exit in NAM-treated medium, we found that cyclin B1 levels were lower and inhibitory Cdk1 phosphorylation was increased compared with controls. Although activation of the anaphase-promoting complex-Cdc20 (APC-Cdc20) occurred on-time in NAM-treated oocytes, Cdc20 levels were higher in very late meiosis I, pointing to exaggerated APC-Cdc20-mediated proteolysis as a reason for lower cyclin B1 levels. Collectively, therefore, our data indicate that by disrupting Cdk1 regulation, NAM impairs entry into meiosis I and the establishment of metaphase II arrest.


Conflict of interest statement

Competing Interests: LW and DS are non-paid directors and shareholders of MetroBiotech NSW Pty Ltd, whose patents concern the use of NAD+ elevating agents to treat disease and are unrelated to nicotinamide (WO2014059034 and Australian provisional patent application number 2013904415). DS is a shareholder and paid consultant to GlaxoSmithKline, a shareholder and scientific advisor to OvaScience, and a shareholder and director to MetroBiotech NSW Pty Ltd and MetroBiotech LLC. None of these interests relate to the present work, use of nicotinamide in oocytes. The authors confirm that they have no restrictions on the sharing of data or materials related to this work. This does not alter the authors' adherence to PLOS ONE policies on sharing data and materials.

Figures

Fig 1
Fig 1. GVBD rates and cyclin B1 expression following release from IBMX.
(A) Rates of GVBD were scored at 1, 2 and 3 h following release from IBMX in control untreated and NAM-treated oocytes (* P < 0.0001, ** P = 0.0011; Data are mean ± SEM; Analysis by Student’s t-test). Numbers of oocytes for each group are shown in parentheses and are pooled data from over 5 replicate experiments. (B) Western blot of cyclin B1 and actin at the GV-stage and at 1 h, 2 h and 3 h following release from IBMX (30 oocytes per sample; shown is a representative blot of 3 replicates). (C) Band intensities from Westerns were quantified and normalised against the intensity at 2 h post-release in control oocytes.
Fig 2
Fig 2. GVBD rates for AGK2- and Ex527-treated oocytes following release from IBMX.
Fully-grown GV-stage oocytes were cultured in IBMX-containing medium treated with either 20 μM AGK2 or 10 μM Ex527 or left untreated. Rates of GVBD were scored at 1 h, 2 h and 3 h following release from IBMX (* P < 0.0001, ** P = 0.0002; Data are mean ± SEM; Analysis by Student’s t-test). Numbers of oocytes for each group are shown in parentheses and are pooled data from 3 replicate experiments.
Fig 3
Fig 3. Spindle assembly and chromosome alignment during meiosis I.
Immunofluorescence staining of oocytes for chromosomes (DNA), kinetochores (labelled using anti-centromere antibody; ACA) and spindle microtubules (β-tubulin) at 2 h, 4 h and 8 h post-GVBD, representing ball, intermediate and bipolar stages, respectively, in controls (A), and NAM-treated (B) oocytes. Panels to the extreme left are whole-oocyte images whilst panels to the right are magnified images of the regions enclosed by the dashed white squares. Scale bars = 10 μm.
Fig 4
Fig 4. Polar body exclusion (PBE) rates and chromosome and spindle morphology in control and NAM-treated oocytes.
(A) PBE rates were scored for control and NAM-treated oocytes at 10 h (n = 103 control and n = 90 NAM), 12 h (n = 104 control and n = 64 NAM), 14 h (n = 122 control and n = 60 NAM) and 20 h (n = 169 control and n = 131 NAM) post-GVBD. Numbers of oocytes are pooled data from 3 or more replicate experiments. Data are mean ± SEM. (B) Control and NAM-treated oocytes that exhibited a clear polar body were immunostained for chromosomes (DNA), kinetochores (ACA) and spindle microtubules (β-tubulin). Note the presence of the central spindle (white arrow) and decondensed chromatin enclosed within a nuclear structure (white arrow head) following NAM treatment. Scale bars = 10 μm.
Fig 5
Fig 5. Effect of NAM treatment on securin and Cdc20 levels and kinetochore Mad2 localisation during meiosis I.
(A) Western blot of securin and actin in control and NAM-treated oocytes at 6 h, 9 h and 14 h post-GVBD (30 oocytes per sample; shown is a representative blot of 3 replicates). Band intensities from Westerns were quantified and normalised against the maximal intensity at 6 h post-GVBD and plotted as a graph. (B) Western blot of Cdc20 and actin in control and NAM-treated oocytes at 6 h, 9 h and 14 h post-GVBD (30 oocytes per sample; shown is a representative blot of 3 replicates). Band intensities from Westerns were quantified and normalised against the maximal intensity at 6 h post-GVBD. (C, D) Changes in kinetochore Mad2 levels during meiosis I. Immunofluorescence staining for chromosomes (DNA), kinetochores (ACA), Mad2 and spindle microtubules (β-tubulin) at 2 h (upper panels) and 8 h (lower panels) post-GVBD in controls (C), and NAM-treated (D) oocytes. Note that at 2 h post-GVBD when spindles are at the ball stage, kinetochores recruit high levels of microtubules and that by 8 h post-GVBD when a bipolar spindle is present, Mad2 is undetectable at kinetochores in both groups. Panels to the extreme left are whole-oocyte images whilst panels to the right are magnified images of the regions enclosed by the dashed white squares. Scale bars = 10 μm.
Fig 6
Fig 6. Effect of NAM treatment at metaphase II and of flavopiridol treatment at 9 h post-GVBD and at metaphase II.
(A) GV-stage oocytes were matured in vitro to metaphase II stage and then incubated in 10 mM NAM for 20 h before being fixed and immunostained. (B, C) GV-stage oocytes were cultured in vitro in standard medium either till 9 h post-GVBD (B) or till metaphase II (C) and were then transferred into medium containing 5 μM flavopiridol for 20 h before being fixed and immunostained. Shown are representative confocal images of oocytes from the different treatment groups immunostained for chromosomes (DNA), kinetochores (ACA), and spindle microtubules (β-tubulin). Note that in the NAM-treated oocytes, a well-formed bipolar spindle bearing condensed chromosomes is readily discernible in the oocyte (A). In contrast, following flavopiridol treatment, microtubules form a diffuse network in the oocyte, a persistent central spindle connects oocyte and PB (white arrows) and decondensed chromatin is observed within a nuclear structure (white arrowheads) (B, C). Significantly, in the 9 h flavopiridol group, there is a single PB (B) whereas in the metaphase II flavopiridol group, three PBs are visible (numbered 1–3). The initial PB that was present before flavopiridol was added divided to form PB1 and PB3 following treatment since neither one is connected to the oocyte by a central spindle; interestingly, they remain connected to one another by a persisting central spindle. Following flavopiridol treatment, PB2 was extruded from the oocyte and remains connected via a second central spindle. Only the phenotype in (B) replicates that observed in oocytes treated with NAM from the GV-stage (see Fig 4B). Scale bars = 10 μm.
Fig 7
Fig 7. Effect of NAM treatment on cyclin B1 and p-Cdk1 levels and of flavopiridol treatment at 6 h post-GVBD.
(A) Western blot of cyclin B1 and actin in control and NAM-treated oocytes at 6 h, 9 h and 14 h post-GVBD (30 oocytes per sample; shown is a representative blot of 3 replicates). Band intensities from Westerns were quantified and normalised against the maximal intensity at 6 h post-GVBD and plotted as a graph. (B) Western blot of p-Cdk1 and actin in control and NAM-treated oocytes at 6 h, 9 h and 14 h post-GVBD (30 oocytes per sample; shown is a representative blot of 3 replicates). Band intensities from Westerns were quantified and normalised against the maximal intensity at 9 h post-GVBD in NAM-treated oocytes. (C) GV-stage oocytes were cultured in vitro in standard medium till 6 h post-GVBD and were then transferred into medium containing 5 μM flavopiridol for 20 h before being fixed and immunostained. Shown are representative confocal images of oocytes immunostained for chromosomes (DNA), kinetochores (ACA), and spindle microtubules (β-tubulin). Note that oocytes have either divided into two (top panel) or four (lower panel) similarly sized cells that remain connected via central spindles (white arrows). Note also that chromatin has decondensed and occurs within a nuclear structure (white arrowheads) but that all DNA is retained within one cell. Scale bars = 10 μm.

References

    1. Gosden R, Lee B. Portrait of an oocyte: our obscure origin. J Clin Invest. 2010;120(4):973–83. 10.1172/JCI41294 - DOI - PMC - PubMed
    1. Adhikari D, Liu K. The regulation of maturation promoting factor during prophase I arrest and meiotic entry in mammalian oocytes. Mol Cell Endocrinol. 2014;382(1):480–7. Epub 2013/08/07. eng. 10.1016/j.mce.2013.07.027 - DOI - PubMed
    1. Solc P, Schultz RM, Motlik J. Prophase I arrest and progression to metaphase I in mouse oocytes: comparison of resumption of meiosis and recovery from G2-arrest in somatic cells. Mol Hum Reprod. 2010;16(9):654–64. 10.1093/molehr/gaq034 - DOI - PMC - PubMed
    1. Homer H. Getting into and out of oocyte maturation In: Trounson A, Gosden R, Eichenlaub-Ritter U, editors. Biology and Pathology of the Oocyte. 2nd ed United Kingdom: Cambridge University Press; 2013. pp. 119–41.
    1. Madgwick S, Jones KT. How eggs arrest at metaphase II: MPF stabilisation plus APC/C inhibition equals Cytostatic Factor. Cell division. 2007;2:4 . Pubmed Central PMCID: PMC1794241. Epub 2007/01/30. eng. - PMC - PubMed

Publication types

LinkOut - more resources