. 2015 Jun;22(6):499-505.
doi: 10.1038/nsmb.2991. Epub 2015 May 4.

Aβ(1-42) fibril structure illuminates self-recognition and replication of amyloid in Alzheimer's disease

Affiliations

Aβ(1-42) fibril structure illuminates self-recognition and replication of amyloid in Alzheimer's disease

Yiling Xiao et al. Nat Struct Mol Biol. 2015 Jun.

Abstract

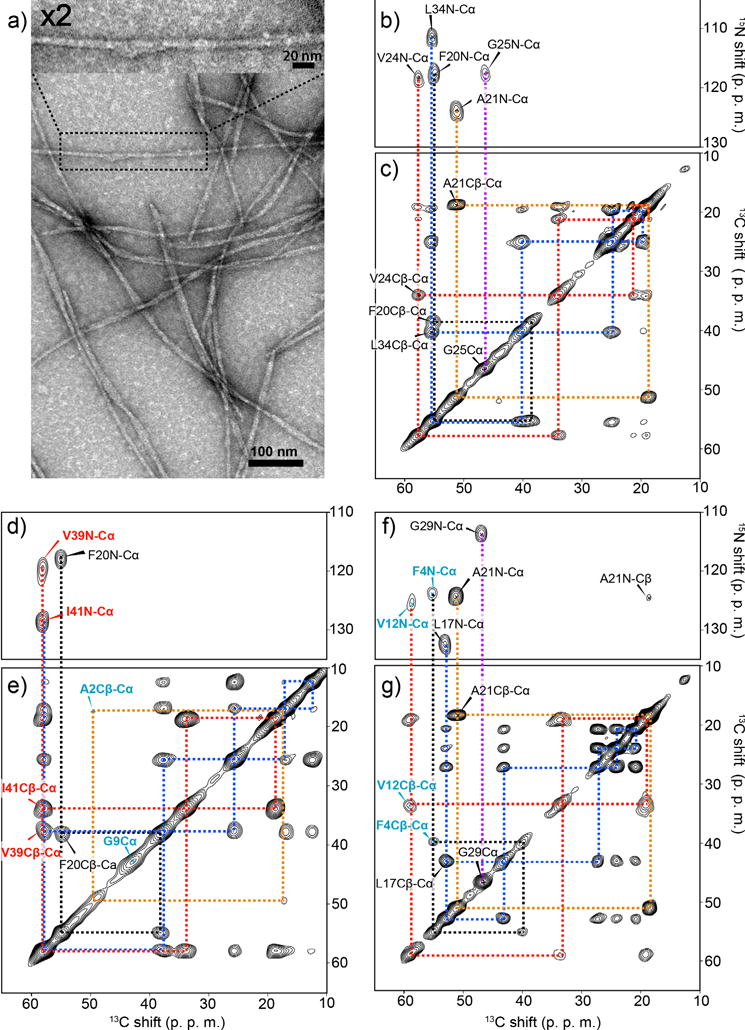
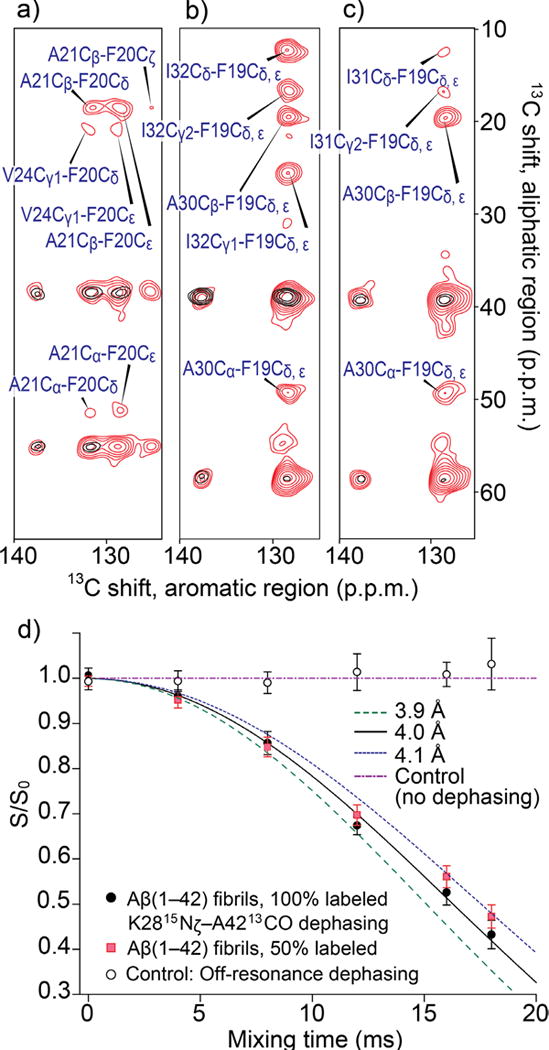
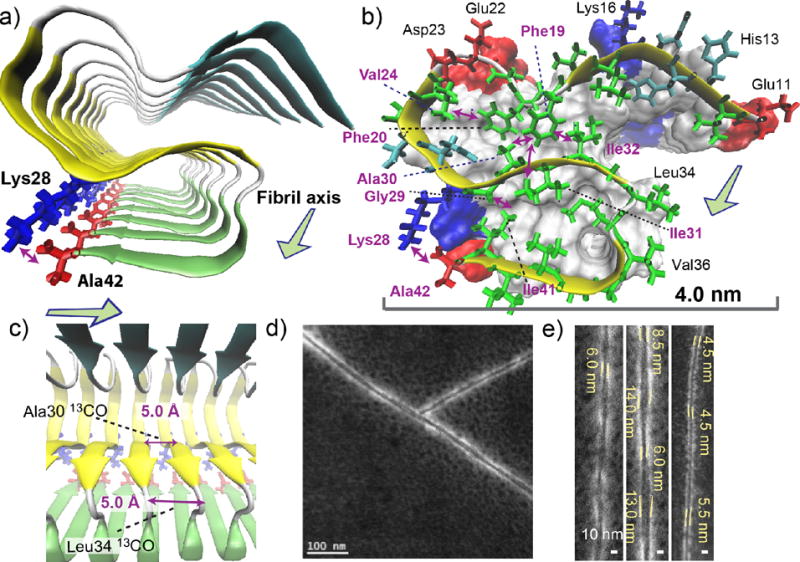
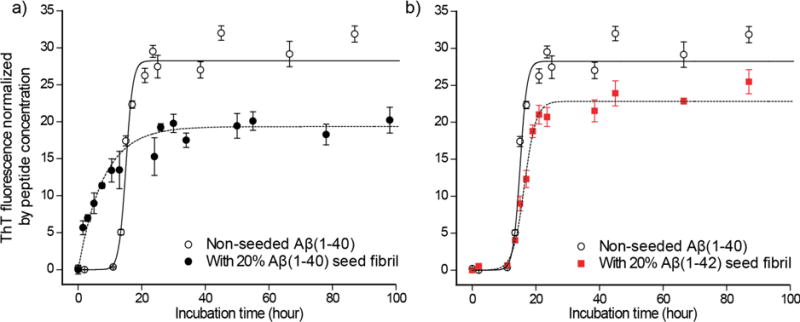
Increasing evidence has suggested that formation and propagation of misfolded aggregates of 42-residue human amyloid β (Aβ(1-42)), rather than of the more abundant Aβ(1-40), provokes the Alzheimer's disease cascade. However, structural details of misfolded Aβ(1-42) have remained elusive. Here we present the atomic model of an Aβ(1-42) amyloid fibril, from solid-state NMR (ssNMR) data. It displays triple parallel-β-sheet segments that differ from reported structures of Aβ(1-40) fibrils. Remarkably, Aβ(1-40) is incompatible with the triple-β-motif, because seeding with Aβ(1-42) fibrils does not promote conversion of monomeric Aβ(1-40) into fibrils via cross-replication. ssNMR experiments suggest that C-terminal Ala42, absent in Aβ(1-40), forms a salt bridge with Lys28 to create a self-recognition molecular switch that excludes Aβ(1-40). The results provide insight into the Aβ(1-42)-selective self-replicating amyloid-propagation machinery in early-stage Alzheimer's disease.


Figures

Figure 1
Figure 1
Structural homogeneity and morphologies analysis of Aβ(1–42) amyloid fibril. (a) Transmission electron microscopy (TEM) images of seeded Aβ(1–42) fibrils. The sample was obtained 24 h after the 4th generation (G4) incubation of an Aβ(1–42) solution with seed Aβ(1–42) fibrils (5% in weight). (b, d, f) 2D 15N–13C correlation SSNMR spectra and (c, e, g) 2D SSNMR 13C–13C correlation spectra of seeded fibril samples labeled with uniformly 13C-, 15N-labeled at (b, c) Phe20, Ala21, Val24, Gly25, Leu34, (d, e) Ala2, Gly9, Phe20, Val39, Ile41, and (f, g) Phe4, Val12, Leu17, Ala21, Gly29. In (b, d, f) 2D DARR spectra with a mixing time of 50 ms present single intra-residue cross peaks for each 13C-13C pair, indicating a single conformer. The base contour levels were set to 4–6 times the root-mean-square (RMS) noise level. The contour levels in the 2D 13C–13C correlation spectra were set to (b) 5%, (d) 7%, and (f) 10% of the diagonal signals of (b, f) 13Cα of Ala21 or (d) Ile41.
Figure 2
Figure 2
SSNMR-based structural constraints for the Aβ(1–42) fibril. (a–c) Superimposed aromatic-aliphatic cross peaks in 2D 13C–13C SSNMR spectra of the same fibril samples obtained with 200-ms (red) and 50-ms (black) mixing times. The observed inter-residue long-range contacts are (a) Phe20–Ala21, Phe20–Val24, (b) Phe19–Ala30, Phe19–Ile32, and (c) Phe19–Ala30, Phe19–Ile31. The samples were labeled with uniformly 13C-, 15N-labeled at (a) Phe20, Ala21, Val24, Gly25, Leu34, (b) Phe19, Ala30, Ile32, Gly38, Val40, and (c) Phe19, Ala30, Ile31, Gly33, and Val36. The base-contour levels were at 4–5 (red) and 6–8 times (black) the RMS-noise levels. (d) Dephasing curves by frequency-selective REDOR for measurement of the distance between Ala42 13CO and Lys28 15Nζ for a 100%-labeled sample (black filled circles) and a 50%-labeled sample obtained by mixing with unlabeled Aβ sample (red filled squares), in comparison with simulated dephasing curves obtained with Spinevolution software for 13C-15N distances of 3.9 Å (olive dashed line), 4.0 Å (black line) and 4.1 Å (blue dashed line). The best-fit data were obtained for the simulated result for 4.0 Å. The carrier frequency for the selective 15N pulse was set to 35 ppm near the Lys28 15Nζ resonance. Open black circles represent control experiments in which 15N was irradiated at off-resonance at 200 ppm. No dephasing was observed for the data, confirming that there were no effects due to 13CO and neighboring amide 15N groups. The errors bars were estimated from the noise level of the spectra.
Figure 3
Figure 3
Structural details of the Aβ(1–42) fibril revealed by the SSNMR analysis. (a–c) A structural model of the amyloid fibril of Aβ(1–42). Disordered residues 1–10 were omitted for clarity. (a) View from the fibril axis shows three β-strand regions (arrows) connected by short coil (white) or turn (silver) regions (tube); the β-strands are represented by color-coded arrows in cyan (resides 12–18), yellow (24–33), and green (36–40). The unique salt bridge between Lys28 (blue) and Ala42 (red) is shown. (b) Side chain contacts for a single Aβ chain in a skeletal and a ribbon diagram with a van der Waals surface and polarity diagram for the rest of the Aβ chains. Hydrophobic, polar, acidic, and basic residues are represented by green, cyan, red, and blue, respectively. Observed long-range side-chain intra-molecular contacts (purple arrows) and inter-molecular contacts (blue arrow) are shown. All β-sheet regions are presented in yellow. The surface plot indicates positively charged (Lys; blue) and negatively charged (Glu, Asp; red) side chains, and Ala42 that has a negatively charged carboxyl group (red). (c) The side view in ribbon diagram. The in-register parallel β-sheet arrangement was confirmed by measurements of intermolecular 13CO-13CO distances of ∼4.8 Å at Ala30 and Leu34 (purple arrows). (d, e) Scanning TEM (STEM) images of seeded fibril filaments. (e) The diameters of the fibril filaments are ranged between 4.5 and 6.0 nm for thinner filaments (left and right) and between 6.0 and 14.0 nm for wider filaments (middle).
Figure 4
Figure 4
Cross-propagation kinetics of Aβ(1–40) monomers incubated with the seed Aβ(1–42) fibrils. Incubation-time dependence of ThT-fluorescence for 50 µM Aβ(1–40) solution incubated (a) with 10 µM Aβ(1–40) G1 seed fibrils (black filled circle) and (b) with 10 µM Aβ(1–42) G3 seed fibrils (red filled square) in comparison with (a, b) the control data for 50 µM Aβ(1–40) without any seed fibrils (black open circle). The identical control data are displayed in (a, b). The data for the Aβ(1–42)-seeded samples display very similar kinetic behaviors and lag times with those for the unseeded Aβ(1–40) solution. The fitting curves (dotted curves) using a sigmoidal equation (see Methods) respectively indicate lag times of 13.0 ± 0.1 h, and 12.8 ± 0.2 h for the unseeded and Aβ(1–42) seeded samples. The Aβ(1–40) seeded data show no lag time, and fits well with curve fitting using an equation that describes the first-order kinetic through a self-replicating reaction (see Methods). The error bars were estimated from the s.d. (n = 3).

References

    1. Dobson CM. Protein folding and misfolding. Nature. 2003;426:884–890. - PubMed
    1. Petkova AT, et al. Self-propagating, molecular-level polymorphism in Alzheimer’s beta-amyloid fibrils. Science. 2005;307:262–265. - PubMed
    1. Stoehr J, et al. Purified and synthetic Alzheimer’s amyloid beta (A beta) prions. Proc Natl Acad Sci U S A. 2012;109:11025–11030. - PMC - PubMed
    1. Lu JX, et al. Molecular Structure of beta-Amyloid Fibrils in Alzheimer’s Disease Brain Tissue. Cell. 2013;154:1257–1268. - PMC - PubMed
    1. Luhrs T, et al. 3D structure of Alzheimer’s amyloid-beta(1–42) fibrils. Proc Natl Acad Sci U S A. 2005;102:17342–17347. - PMC - PubMed
Online Method References
    1. Noguchi A, et al. Isolation and Characterization of Patient-derived, Toxic, High Mass Amyloid beta-Protein (A beta) Assembly from Alzheimer Disease Brains. J Biol Chem. 2009;284:32895–32905. - PMC - PubMed
    1. Chimon S, Ishii Y. Capturing intermediate structures of Alzheimer’s b-amyloid, Ab(1–40), by solid-state NMR spectroscopy. J Am Chem Soc. 2005;127:13472–13473. - PubMed
    1. Delaglio F, et al. Nmrpipe – a Multidimensional Spectral Processing System Based on Unix Pipes. J Biomol NMR. 1995;6:277–293. - PubMed
    1. Gullion T, Baker DB, Conradi MS. New, Compensated Carr-Purcell Sequences. J Magn Reson. 1990;89:479–484.
    1. Dames SA, Martinez-Yamout M, De Guzman RN, Dyson HJ, Wright PE. Structural basis for Hif-1 alpha/CBP recognition in the cellular hypoxic response. Proc Natl Acad Sci U S A. 2002;99:5271–5276. - PMC - PubMed

Publication types

Associated data