. 2015 Jun 11;522(7555):240-244.
doi: 10.1038/nature14345. Epub 2015 May 4.

Histone H3.3 is required for endogenous retroviral element silencing in embryonic stem cells

Affiliations

Histone H3.3 is required for endogenous retroviral element silencing in embryonic stem cells

Simon J Elsässer et al. Nature. .

Abstract

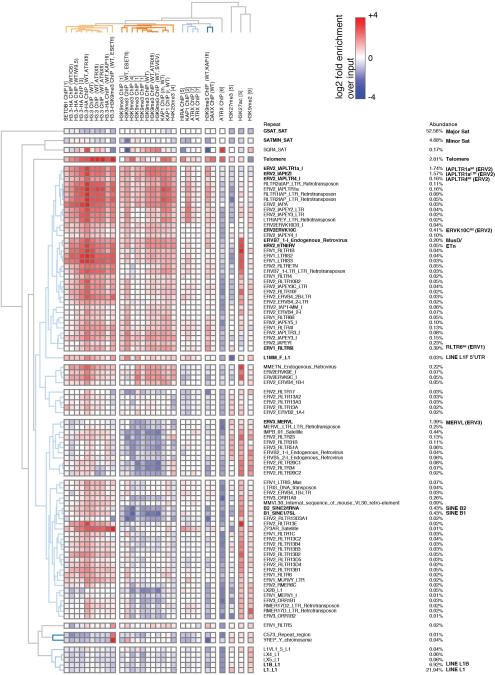
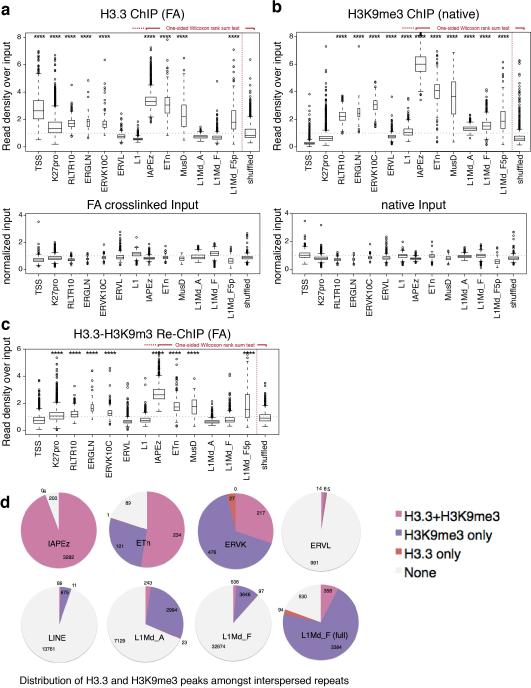
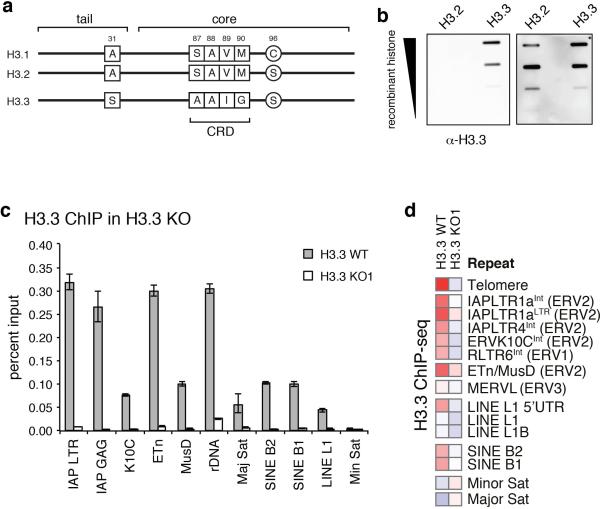
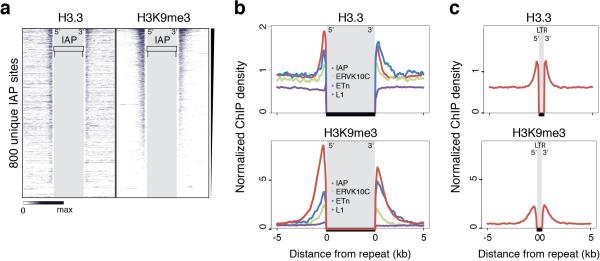
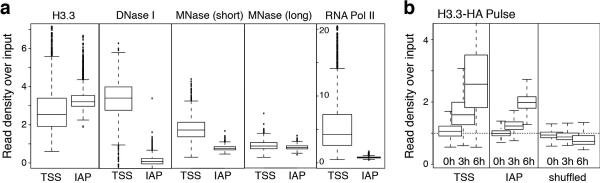
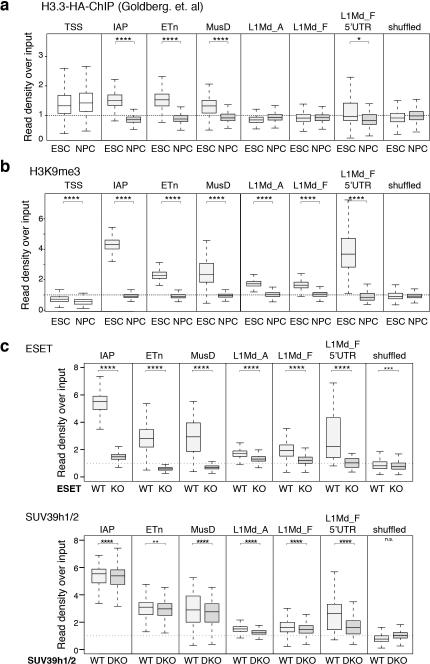
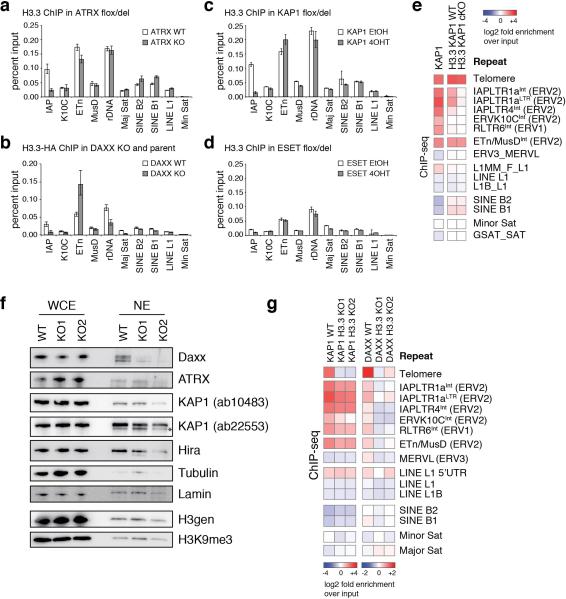
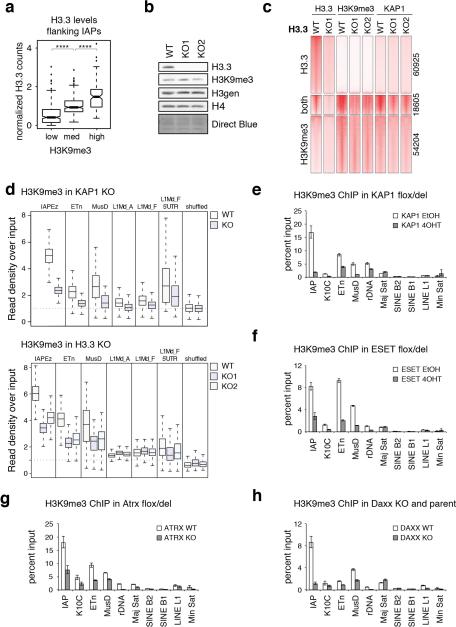
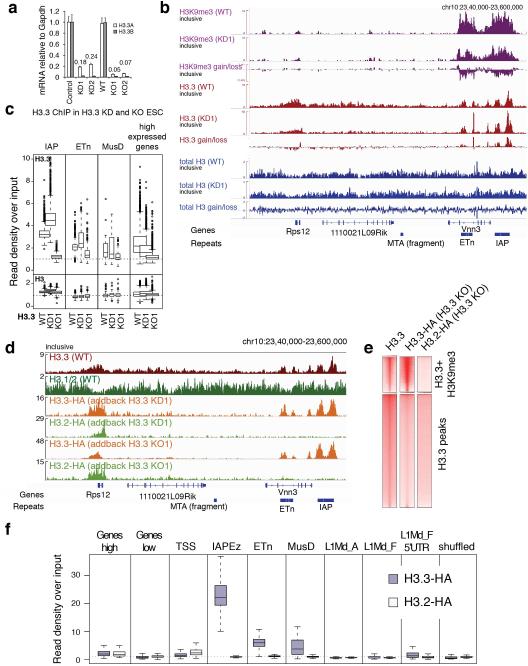
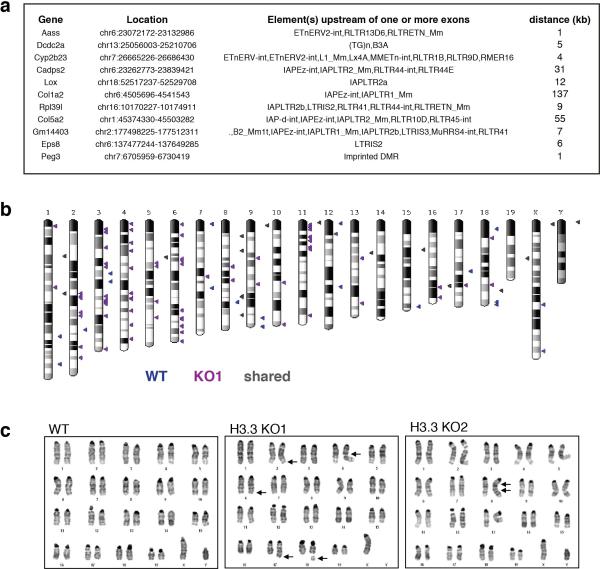
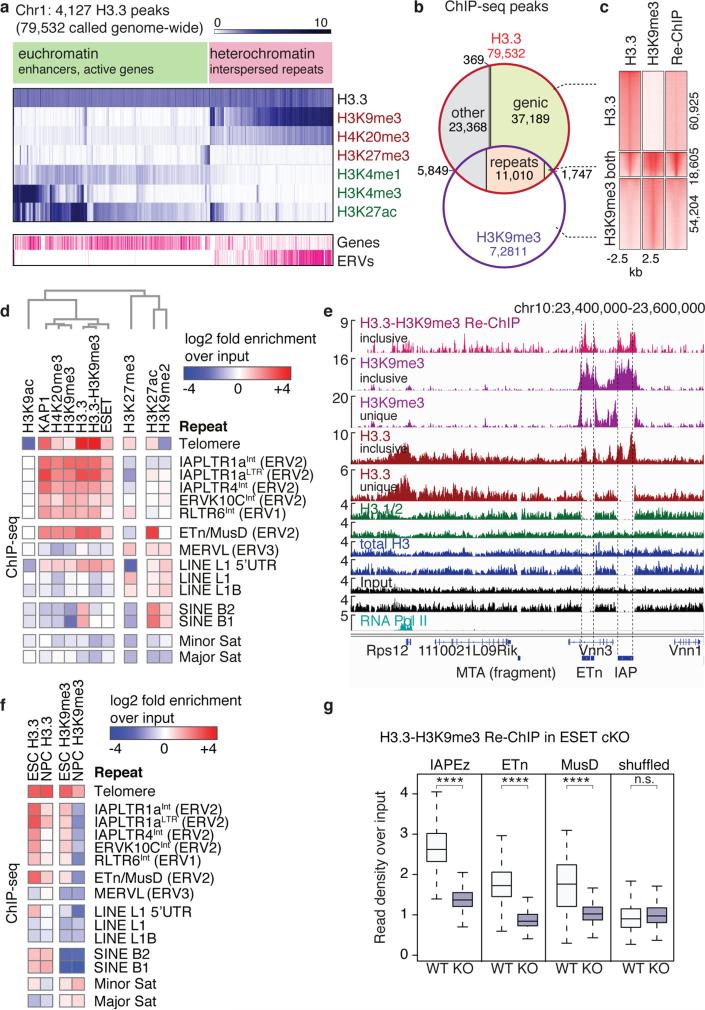
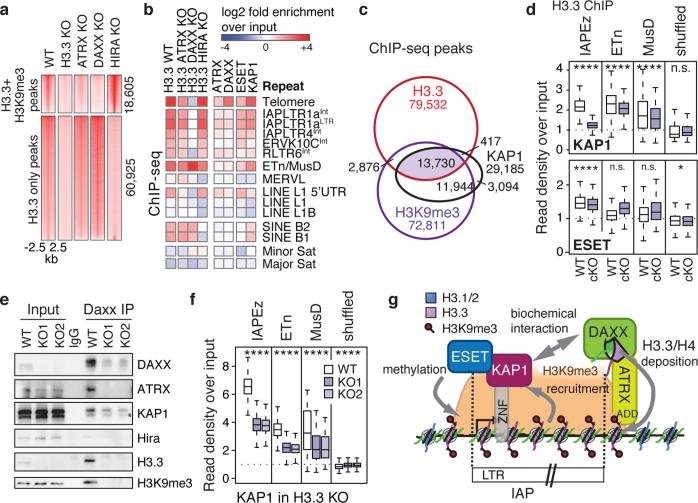
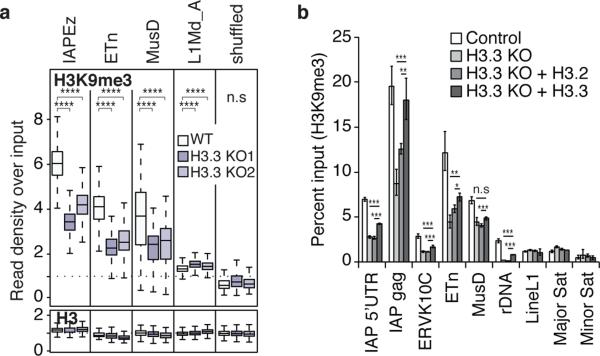
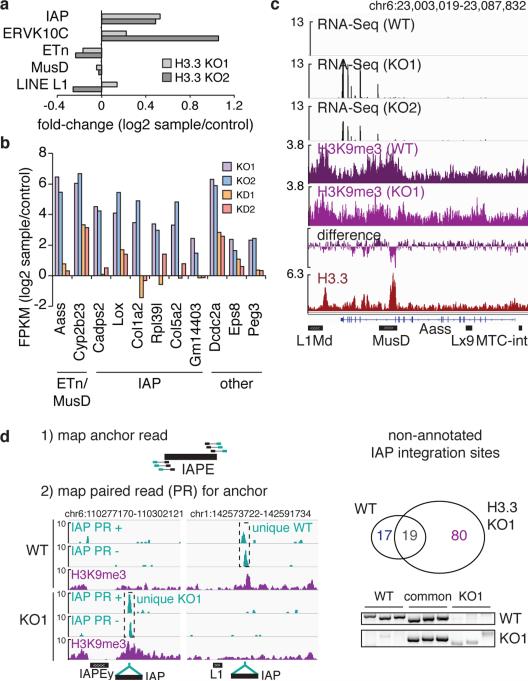
Transposable elements comprise roughly 40% of mammalian genomes. They have an active role in genetic variation, adaptation and evolution through the duplication or deletion of genes or their regulatory elements, and transposable elements themselves can act as alternative promoters for nearby genes, resulting in non-canonical regulation of transcription. However, transposable element activity can lead to detrimental genome instability, and hosts have evolved mechanisms to silence transposable element mobility appropriately. Recent studies have demonstrated that a subset of transposable elements, endogenous retroviral elements (ERVs) containing long terminal repeats (LTRs), are silenced through trimethylation of histone H3 on lysine 9 (H3K9me3) by ESET (also known as SETDB1 or KMT1E) and a co-repressor complex containing KRAB-associated protein 1 (KAP1; also known as TRIM28) in mouse embryonic stem cells. Here we show that the replacement histone variant H3.3 is enriched at class I and class II ERVs, notably those of the early transposon (ETn)/MusD family and intracisternal A-type particles (IAPs). Deposition at a subset of these elements is dependent upon the H3.3 chaperone complex containing α-thalassaemia/mental retardation syndrome X-linked (ATRX) and death-domain-associated protein (DAXX). We demonstrate that recruitment of DAXX, H3.3 and KAP1 to ERVs is co-dependent and occurs upstream of ESET, linking H3.3 to ERV-associated H3K9me3. Importantly, H3K9me3 is reduced at ERVs upon H3.3 deletion, resulting in derepression and dysregulation of adjacent, endogenous genes, along with increased retrotransposition of IAPs. Our study identifies a unique heterochromatin state marked by the presence of both H3.3 and H3K9me3, and establishes an important role for H3.3 in control of ERV retrotransposition in embryonic stem cells.


Figures

Extended Data Figure 1
Extended Data Figure 1. H3.3 and H3K9me3 correlate within the mouse repetitive mESC genome
Related to Figure 1. Hierarchically (Spearman Rank) clustered heatmap showing occupancy of histone H3.3 and known heterochromatic histone modification and factors over a comprehensive set of mouse repetitive sequences (see Methods for details). Published datasets used are listed in the Methods section. Data is represented as log2 fold enrichment over matched inputs for each ChIP dataset. Repeats with less then 0.01% abundance are omitted.
Extended Data Figure 2
Extended Data Figure 2. H3.3 and H3K9me3 co-occupy class I and II ERVs
Related to Figure 1. a, Direct comparison of H3.3 enrichment at genic and repetitive sites. Box plot (top) showing enrichment of H3.3 over sets of intervals either representing genic or repetitive elements annotated in the reference genome, using inclusive read mapping. H3.3 ChIP was performed using an H3.3 antibody and FA crosslinking in H3.3 WT cell line. H3.3 enrichment is shown as standardized ChIP-seq read density divided by the standardized input read density on a per-interval basis. The width of the box is proportional to the number of intervals in each group. TSS are transcription start sites of highly active genes; K27pro are bivalent promoters. Box plot (bottom) is showing the input read density (standardized by scaling to a genome-wide mean of 1), confirming the even representation of unique and repetitive sequences resulting from the inclusive mapping procedure (see Methods for details). Result of one-sided Wilcoxon rank sum test against a set of randomly selected genomic intervals (shuffled) is indicated (**** = p < 0.0001) b, H3K9me3 enrichment at genic and repetitive sites. H3K9me3 ChIP was performed using MNase digestion under native conditions. Box plot (top) showing enrichment of H3K9me3 over sets of intervals either representing genic or repetitive elements analogous to a. Box plot (bottom) is showing the input read density analogous to a. Result of one-sided Wilcoxon rank sum test against a set of randomly selected genomic intervals (shuffled) is indicated (**** = p < 0.0001). c, Sequential H3.3 and H3K9me3 (Re)-ChIP at genic and repetitive sites. Boxplots showing enrichment of Re-ChIP inclusive read mapping relative to an input control. Result of one-sided Wilcoxon rank sum test against a set of randomly selected genomic intervals (shuffled) is indicated (**** = p < 0.0001). d, Co-occupancy of H3.3 and H3K9me3 at specific classes of ERVs. H3.3 and H3K9me3 peak intervals were independently intersected with annotated ERVs and their co-ocurrences within the same ERV were evaluated. L1Md_F (full) is a subset of L1Md_F, comprising only full length repeats (>5 kb). All Pie charts include total number of intervals for each family that had none, (at least) one H3.3 peak (H3.3 only), or H3K9me3 peak(s) (H3K9me3 only), or at least one of each (H3.3+H3K9me3).
Extended Data Figure 3
Extended Data Figure 3. Generation of H3.3-isoform specific antibodies
Related to Figure 1. a, Schematic of amino acid sequence differences for the canonical histones H3.1 and H3.2 versus the histone variant H3.3. H3.3 differs from H3.2 or H3.1 at only 4 or 5 amino acids, positions 31, 87, 89, 90, and 96 as indicated. b, Immunoblot against recombinant histones using the final purified antibody (Millipore 09-838), confirming specificity of H3-isoform specific antibodies. c, ChIP-qPCR analysis of H3.3 enrichment at various repeat regions in control and H3.3 KO ESCs. Error bars represent s.d. from one experiment (n=3). d, ChIP-seq enrichment of H3.3 at repetitive regions of the mouse genome in control and H3.3 KO ESCs. Data are represented in a heatmap of log2 fold enrichment (red) or depletion (blue) over a matched input.
Extended Data Figure 4
Extended Data Figure 4. H3.3 is enriched in regions flanking ERVs and orphan LTRs
Related to Figure 1. a, ChIP-seq density heat maps for unique sites flanking full-length IAP ERVs (n=800) rank ordered by H3K9me3 enrichment. Color intensity represents normalized and globally scaled tag counts. b, H3.3 (top panel) and H3K9me3 (bottom panel) enrichment over regions flanking IAP, ERVK10C, ETn ERVs and L1 elements. H3.3 ChIP-seq was performed with FA crosslinking, H3K9me3 ChIP-seq under native conditions. Average profiles were aligned and aggregated at the 5’ and 3’ boundaries of hundreds of annotated elements from standardized unique read count coverage tracks. The profiles are directional with the 5’ ends on the left and 3’ end on the right. c H3.3 (top panel) and H3K9me3 (bottom panel) enrichment over regions flanking single (so-called orphan) IAP LTRs, ~500 bp. Orphan LTRs are the result of a recombination event between two LTRs – usually the 3’ and 5’ LTRs of the same ERV – effectively deleting the internal coding sequence. ~600 full-length LTRs (~500 bp) enriched in H3.3 and H3K9me3 were identified in the mouse genome and aggregated for the profiles.
Extended Data Figure 5
Extended Data Figure 5. H3.3 at IAPs is not associated with transcription, DNase I or MNase sensitivity
Related to Figure 1. a, Direct comparison of chromatin properties at transcription start sites (TSS) of highly expressed genes and IAP ERVs. Box plots showing (from left to right) comparable enrichment of H3.3; DNase I sensitivity; MNase sensitivity; Elongating RNAP2 occupancy. MNase datasets are from a recent study, showing H3.3 localizing to MNase hypersentitive regions such as active promoters; In this study, MNase sensitivity was assessed by sequencing nucleosomes released under mild (‘short’) or extensive (‘long’) MNase digestion conditions; MNase hypersensitive sites were shown to be specifically enriched by mild MNase digestion, where as long digestion released chromatin more evenly. b, Comparison of kinetics of H3.3 incorporation at the TSS of highly expressed genes and IAP ERVs; as control, a randomized set of intervals are shown.
Extended Data Figure 6
Extended Data Figure 6. H3.3 and ESET-dependent H3K9me3 enrichment at IAPs is lost upon differentiation
Related to Figure 1. a and b, Comparison of H3.3 (a) and H3K9me3 (b) enrichment at the TSS of highly expressed genes and various repeat classes in ESC and neuronal precursor cells using inclusive read mapping. H3.3 ChIP was performed using a genomic knock-in tagged H3.3B-HA and FA crosslinking. H3K9me3 ChIP was performed using FA crosslinking. Enrichment is shown as standardized ChIP-seq read density divided by the standardized input read density on a per-interval basis. Result of one-sided Wilcoxon signed rank test (NPC vs ESC) are shown (**** = p<0.0001; *** = p<0.0005; ** = p<0.005; * = p<0.05; no annotation = not significant). c, Levels of H3K9me3 enrichment in control and ESET KO ESCs (top) or control and SUV39h1/2 KO ESCs (bottom) at various repeat classes. Data are represented as in panels a and b.
Extended Data Figure 7
Extended Data Figure 7. Contribution of DAXX, ATRX, KAP1, and ESET to H3.3 enrichment at ERVs
Related to Figure 2. a-d, ChIP-qPCR analysis of H3.3 enrichment at various repeat regions in control and ATRX KO (a), DAXX KO (b), KAP1 KO (c), and ESET KO (d) ESCs. Error bars represent s.d. from one experiment (n=3). Data are representative of 2 independent ChIP experiments. e, ChIP-seq enrichment of KAP1 and H3.3 in control and KAP1 KO ESCs at repetitive regions of the mouse genome. Data are represented in a heatmap of log2 fold enrichment (red) or depletion (blue) over a matched input. f, Loss of H3.3 reduces nuclear DAXX levels. Immunoblot from whole cell extracts (WCE) or nuclear extracts (NE) in the presence and absence of H3.3. Asterisk denotes cross-reacting band. g, ChIP-seq enrichment of KAP1 and DAXX in control and H3.3 KO ESCs. Data are represented as in panel e. Note the different color scale used for KAP1 and DAXX.
Extended Data Figure 8
Extended Data Figure 8. Effects of H3.3 and corepressor complex depletion on H3K9me3 heterochromatin
Related to Figure 3. a, Positive correlation of H3.3 and H3K9me3 at IAP ERVs. H3.3 ChIP-seq enrichment at 800 unique IAP flanking regions (see Fig. 1e) was binned into three groups by their H3K9me3 ChIP-seq enrichment (low, medium and high). Wilcoxon rank sum test (****=p<0.0001). b, Immunoblot from ESC whole cell lysates in the presence and absence of H3.3. c, H3.3, H3K9me3 and KAP1 ChIP-seq density heat maps for peaks classified as H3.3 only (n=60,925), both H3.3 and H3K9me3 (n=18,605), or H3K9me3 only (n=54,204) in control and H3.3 KO ESC. 5kb intervals around peak centers are shown. Color intensity represents normalized and globally scaled tag counts. d, Levels of H3K9me3 at IAP, ETn, MusD ERVs and LINE elements in control and KAP1 KO ESCs (top) and control and H3.3 KO ESCs (bottom). Box plots show enrichment over matched input. e-h, ChIP-qPCR analysis of H3K9me3 at various repeat regions in control and KAP1 KO (e), ESET KO (f), ATRX KO (g), and DAXX KO (h) ESCs. Error bars represent s.d. from one experiment (n=3). Data are representative of 2 independent ChIP experiments.
Extended Data Figure 9
Extended Data Figure 9. Global effects of H3.3 depletion
Related to Figure 3. a, H3.3 transcript levels in control, H3.3 KD, and H3.3 KO ESCs. Data are represented as mean expression relative to Gapdh ± s.d. (n=3). b, Relative gain/loss upon H3.3 knockdown of H3K9me3, H3.3, and total H3 are shown over a section of chr10 containing the highly transcribed Rps12 gene and several ERVs. Gain/loss tracks are calculated by subtracting the respective control from H3.3 KD1 tracks, both standardized to a global mean of 1. Note that H3.3 ChIP-seq data in KD1 cells represents the remaining 10% H3.3. The global loss of H3.3 is not directly apparent from the track due to the necessary normalization of the data. The H3.3-difference track thus does not indicate the global loss of H3.3 but merely represent the relative redistribution of the remaining H3.3 from active genes (Rps12) towards repetitive sequences. c, Levels of H3.3 and H3 and IAP, ETn, MusD, and the TSS of highly expressed genes in control, H3.3 KD, and H3.3 KO ESCs. Box plots show enrichment over matched input. d, Incorporation of exogenous, constitutively expressed, H3.3 and H3.2 added back into H3.3 KD or H3.3 KO ESCs. H3.2 cannot substitute for H3.3 at repetitive ERVs but is efficiently incorporated at sites of active transcription. ChIP-seq was performed on lentivirally integrated H3.3-HA and H3.2-HA in H3.3 KD1 and H3.3 KO1. e, ChIP-seq density heat maps for peaks classified as enriched with both H3.3 and H3K9me3 (n=18,605) or H3.3 only (n=60,925). Color intensity represents tag counts scaled and normalized globally. f, Quantification of H3.3-HA and H3.2-HA add-back in H3.3 KO enrichment at low and highly expressed genes, as well as the TSS (+/− 1kb) of the latter, IAP, ETn, and MusD ERVs, and full-length LINE elements and their 5’ promoter regions. Data is represented as enrichment over input.
Extended Data Figure 10
Extended Data Figure 10. ERV reactivation upregulates adjacent genes and may be linked to unbalanced chromosomal translocations
Related to Figure 4. a, Repetitive elements associated with genes in Fig 4b. Elements that were found either within or nearby the transcription unit are listed and the closest distance of an ERV to an exon is given (accounting for the possibility that ERVs could initiate a partial transcript from an alternative start site). b, Newly annotated sites of IAP integration in WT and H3.3 KO1 are indicated on karyogram. c, Karyotype analysis of wild type and H3.3 KO ESCs. Abnormal karyotype indicated by arrows. All analyzed cells in H3.3 KO1 had a small reciprocal translocation between chromosomes 2q and 6q and an unbalanced translocation between chromosomes 6 and 17 resulting in partial gain of chromosomal segment 6qD to 6qG and partial loss of chromosomal segment 17qE2 to 17qE5. Approximately 45% of the cells had chromosomal breaks or gaps (1-2/cell). Approximately 45% of the H3.3 KO2 ESCs had a duplication of the segment 8qC to 8qD resulting in partial gain of this segment.
Figure 1
Figure 1. H3.3 is co-enriched with H3K9me3 at class I and II ERVs associated heterochromatin
a, Hierarchical (Spearman rank) clustering of H3.3 peaks on chromosome 1 with histone modifications associated with active (green) or repressed (red) chromatin states. Annotated genes and ERVs are shown. b, Venn diagram of H3.3 and H3K9me3 peaks demonstrating overlap at repetitive elements. c, ChIP-seq density heat maps for peaks classified as H3.3 only (n=60,925), both H3.3 and H3K9me3 (n=18,605), or H3K9me3 only (n=54,204). Color intensity represents normalized and globally scaled tag counts. d, ChIP-seq enrichment of H3.3 and heterochromatic histone modifications and factors mapped to the repetitive genome. Data are represented in a hierarchically (Spearman rank) clustered heatmap of log2 fold enrichment (red) or depletion (blue) over a matched input. See Extended Data Fig. 1 for complete heatmap. e, Genome browser ChIP-seq representations in ESCs. Read counts are normalized to total number of reads for each data set and exclude (‘unique’) or include (‘inclusive’) repetitive reads. f, ChIP-seq enrichment of H3.3 and H3K9me3 at various repeat regions in ESCs and NPCs. Data are represented as in panel d. g, Levels of co-enriched H3.3-H3K9me3 in control and ESET cKO ESCs. One-sided Wilcoxon signed rank test (**** = p<0.0001; n.s. = not significant).
Figure 2
Figure 2. DAXX/ATRX is responsible for H3.3 deposition at a subset of ERVs and co-localizes with ERV-specific heterochromatic factors
a, ChIP-seq density heat maps for peaks classified as both H3.3 and H3K9me3 (n=18,605) or H3.3 only (n=60,925). Color intensity represents normalized and globally scaled tag counts. b, ChIP-seq enrichment of H3.3 chaperones and chaperone-dependent H3.3 deposition at repetitive regions. Data are represented in a heatmap of log2 fold enrichment (red) or depletion (blue) over a matched input. c, Venn diagram of H3.3, H3K9me3, and KAP1 peaks demonstrating substantial overlap in ESCs. d, Levels of H3.3 in control and KAP1 cKO (top) and control and ESET cKO (bottom) ESCs. One-sided Wilcoxon signed rank test (**** = p<0.0001; * = p<0.05; n.s. = not significant). e, Immunoblotting of DAXX immunoprecipitated from wild type or H3.3-null nuclear extracts showing co-immunoprecipitation with ATRX, H3.3, H3K9me3, and KAP1 independent of H3.3 (1% input). Asterisk denotes cross-reacting band. f, Levels of KAP1 in control and H3.3 KO ESCs. Data is presented as in panels d. g, Model of corepressor complex function at IAPs: KAP1 recognizes ERVs through sequence-specific KRAB zinc finger (ZNF) DNA binding proteins and recruits DAXX/ATRX independently of its interaction with ESET. DAXX/ATRX deposit H3.3 at IAPs, facilitating efficient KAP1 association with chromatin. ESET is then recruited, resulting in H3K9me3-mediated silencing of ERVs.
Figure 3
Figure 3. H3.3 is required for the maintenance of H3K9me3 at specific class I and II ERVs
a, Levels of H3K9me3 and total H3 in control and H3.3 KO ESCs. One-sided Wilcoxon signed rank test (**** = p<0.0001; n.s. = not significant). b, ChIP-qPCR analysis of H3K9me3 enrichment at various repeat regions in control ESCs and H3.3 KO ESCs exogenously expressing either H3.2 or H3.3. Error bars represent s.d. from one experiment (n=3). Data are representative of 3 independent ChIP experiments. (* p<0.05, ** p<0.01, *** p<0.001, t-test).
Figure 4
Figure 4. Loss of H3.3 leads to ERV derepression
a, RNA-seq analysis of repeat transcripts. Data are represented as log2 change in transcript over control for H3.3 KO1 and KO2 ESCs. b, RNA-seq analysis of transcripts with nearby ERVs that are significantly upregulated in H3.3 KO1 and KO2 (q<0.05) (see Extended Data Figure 10a). Data are represented as in panel a. Nearby ERV classes are indicated. c, Representative example of an upregulated transcript in the absence of H3.3. RNA-seq tracks (black) show all reads mappable to the genome (without restriction to known transcripts). H3K9me3 (purple and violet) and H3.3 (red) tracks show inclusive reads as standardized read densities. The relative H3K9me3 difference between WT and KO is shown in a separate track (‘difference’). d, Paired-end based de-novo discovery of non-annotated IAP integration sites in control and H3.3 KO1 ESCs (for details see Methods). Venn diagram and PCR genotyping validation of non-annotated IAP integration sites in control and H3.3 KO1 ESCs.

Comment in

  • On the role of H3.3 in retroviral silencing.
    Wolf G, Rebollo R, Karimi MM, Ewing AD, Kamada R, Wu W, Wu B, Bachu M, Ozato K, Faulkner GJ, Mager DL, Lorincz MC, Macfarlan TS. Wolf G, et al. Nature. 2017 Aug 2;548(7665):E1-E3. doi: 10.1038/nature23277. Nature. 2017. PMID: 28770848 Free PMC article. No abstract available.

References

    1. Waterston RH, et al. Initial sequencing and comparative analysis of the mouse genome. Nature. 2002;420:520–562. doi:10.1038/nature01262. - PubMed
    1. Longo MS, Carone DM, Green ED, O'Neill MJ, O'Neill RJ. Distinct retroelement classes define evolutionary breakpoints demarcating sites of evolutionary novelty. BMC Genomics. 2009;10:334. doi:10.1186/1471-2164-10-334. - PMC - PubMed
    1. Lee J, Han K, Meyer TJ, Kim HS, Batzer MA. Chromosomal inversions between human and chimpanzee lineages caused by retrotransposons. PLoS One. 2008;3:e4047. doi:10.1371/journal.pone.0004047. - PMC - PubMed
    1. Feschotte C, Gilbert C. Endogenous viruses: insights into viral evolution and impact on host biology. Nat Rev Genet. 2012;13:283–296. doi:10.1038/nrg3199. - PubMed
    1. Karimi MM, et al. DNA methylation and SETDB1/H3K9me3 regulate predominantly distinct sets of genes, retroelements, and chimeric transcripts in mESCs. Cell Stem Cell. 2011;8:676–687. doi:10.1016/j.stem.2011.04.004. - PMC - PubMed

Publication types

Associated data