. 2015 Jun;18(6):883-91.
doi: 10.1038/nn.4015. Epub 2015 May 4.

Spine pruning drives antipsychotic-sensitive locomotion via circuit control of striatal dopamine

Affiliations

Spine pruning drives antipsychotic-sensitive locomotion via circuit control of striatal dopamine

Il Hwan Kim et al. Nat Neurosci. 2015 Jun.

Abstract

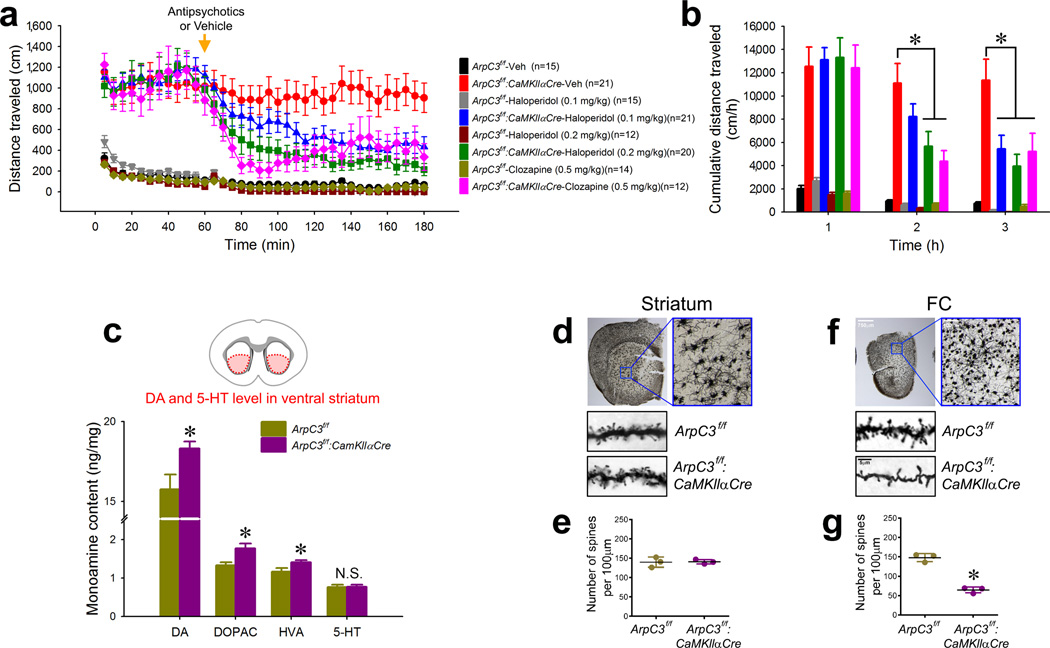
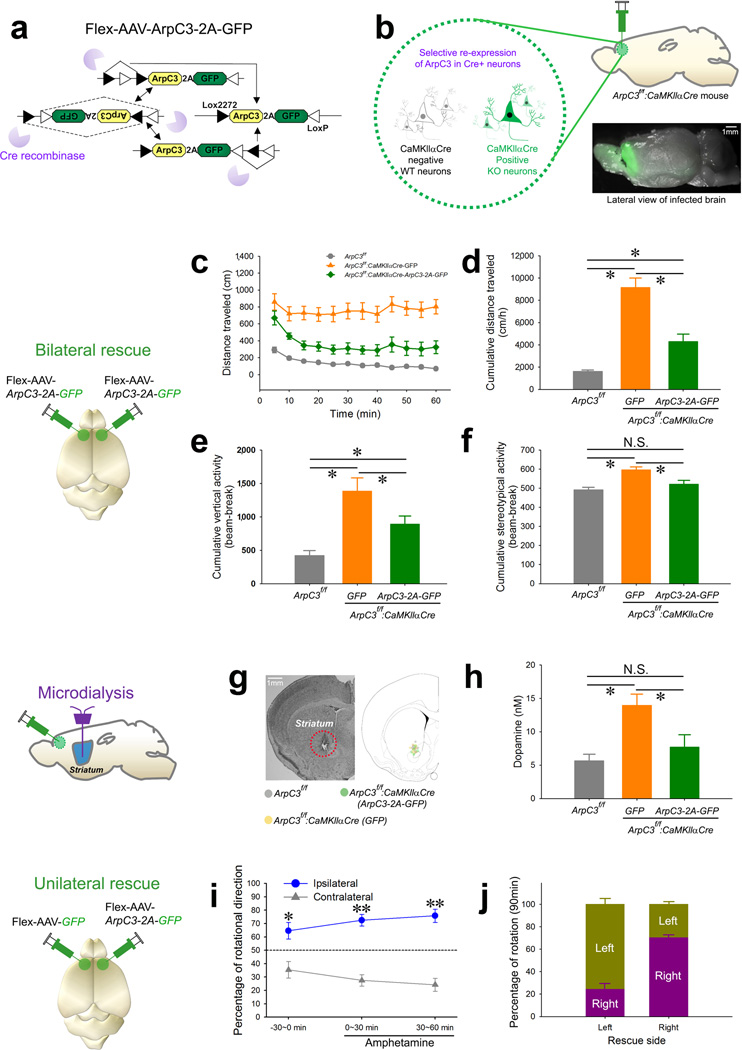
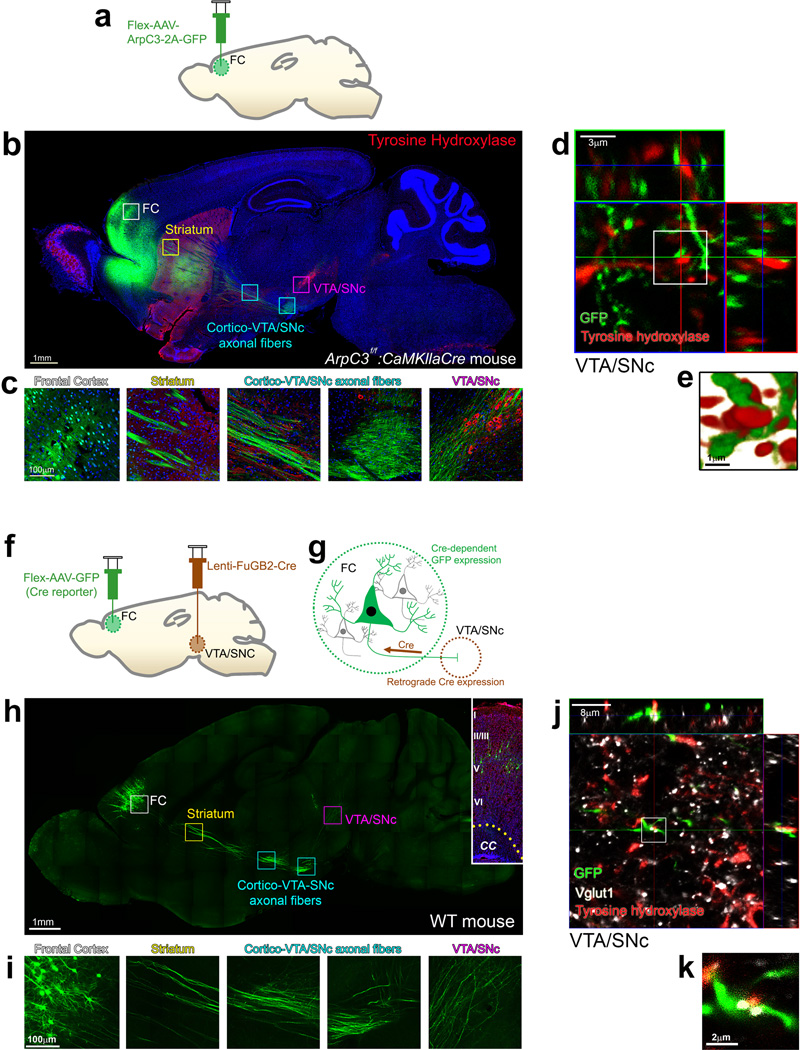
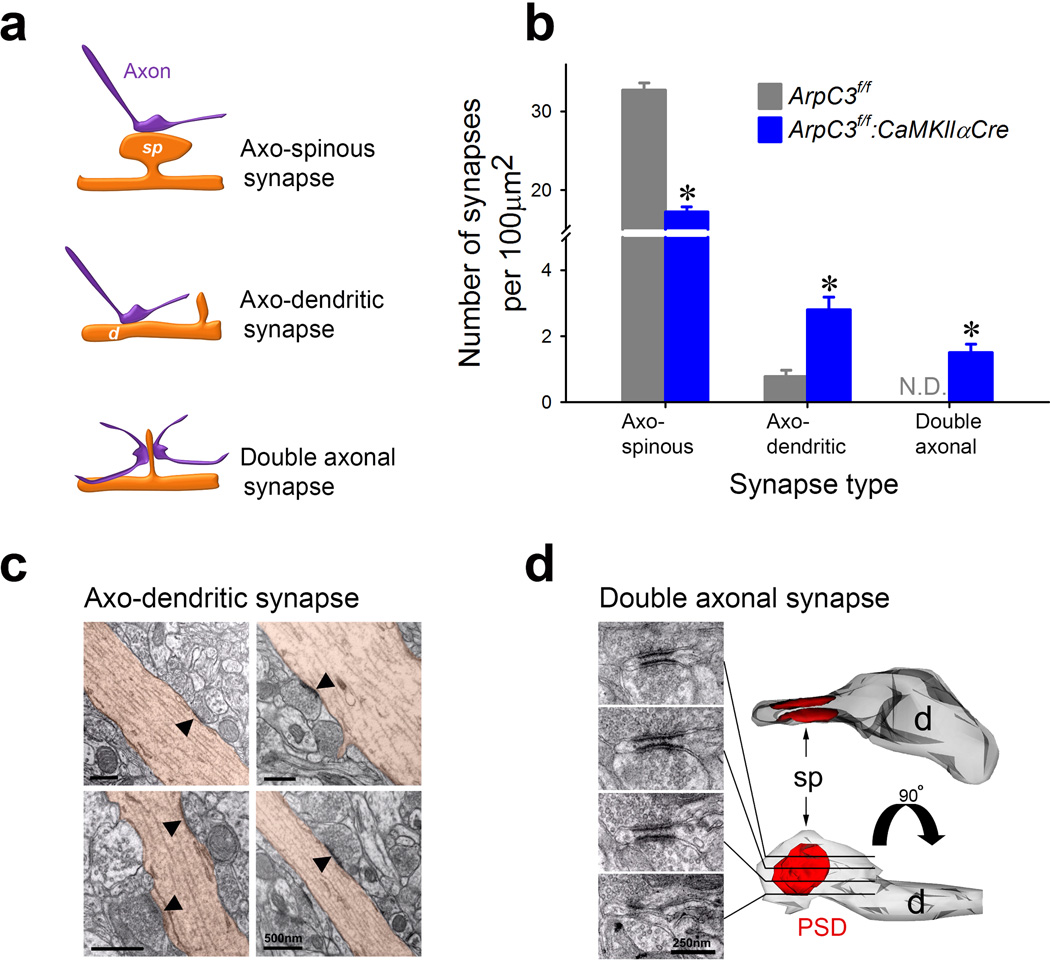
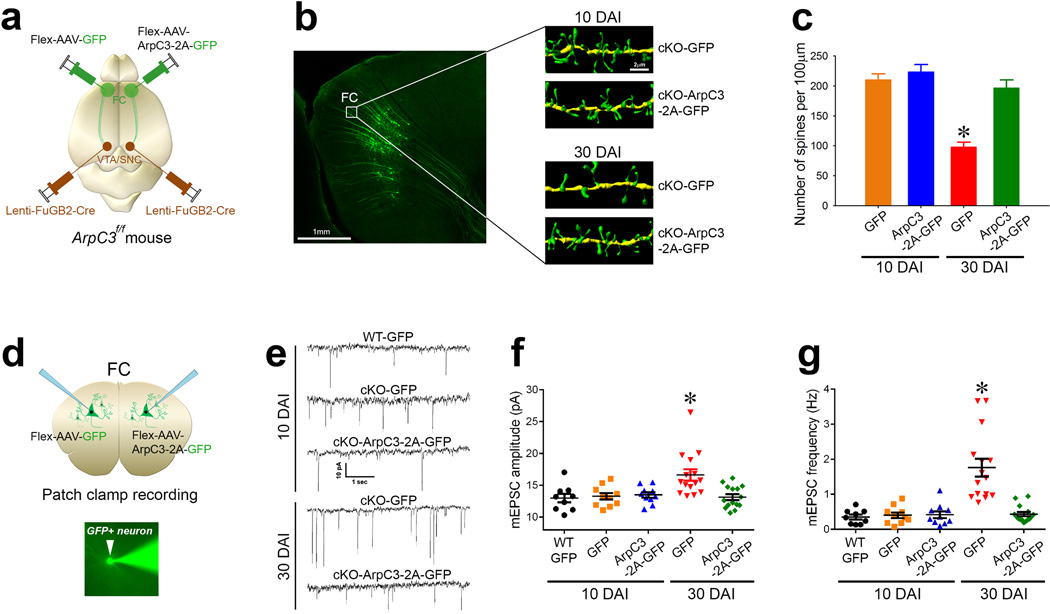
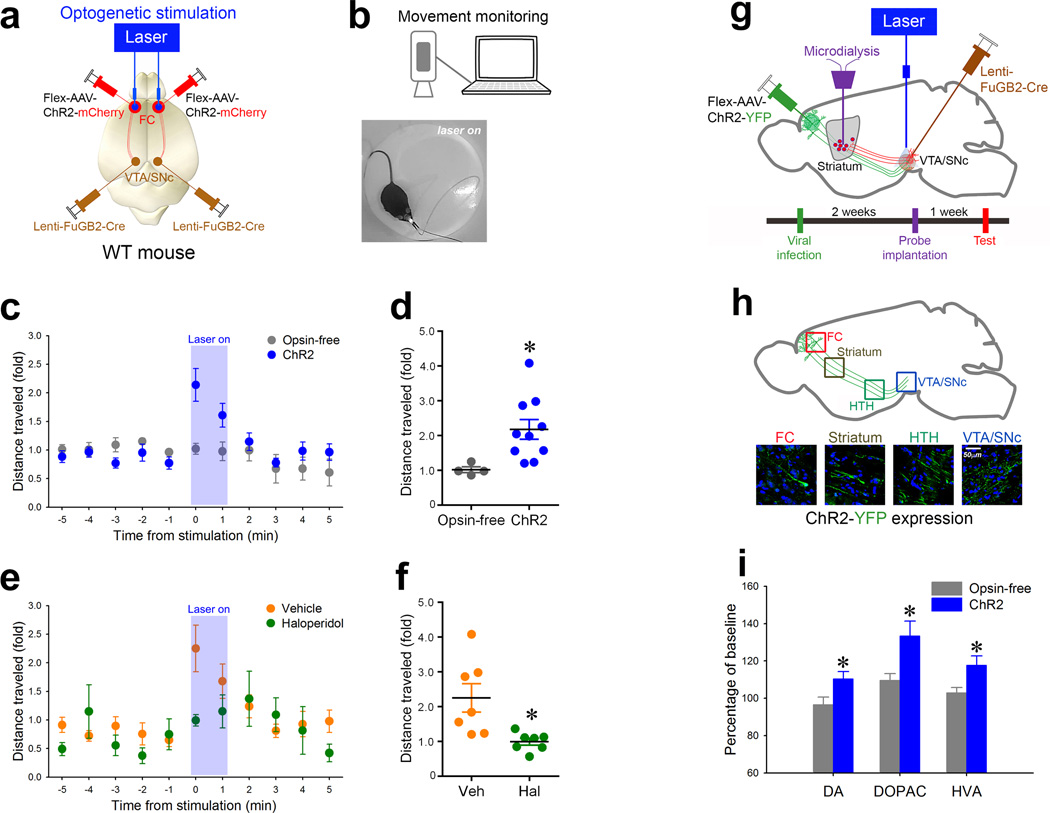
Psychiatric and neurodevelopmental disorders may arise from anomalies in long-range neuronal connectivity downstream of pathologies in dendritic spines. However, the mechanisms that may link spine pathology to circuit abnormalities relevant to atypical behavior remain unknown. Using a mouse model to conditionally disrupt a critical regulator of the dendritic spine cytoskeleton, the actin-related protein 2/3 complex (Arp2/3), we report here a molecular mechanism that unexpectedly reveals the inter-relationship of progressive spine pruning, elevated frontal cortical excitation of pyramidal neurons and striatal hyperdopaminergia in a cortical-to-midbrain circuit abnormality. The main symptomatic manifestations of this circuit abnormality are psychomotor agitation and stereotypical behaviors, which are relieved by antipsychotics. Moreover, this antipsychotic-responsive locomotion can be mimicked in wild-type mice by optogenetic activation of this circuit. Collectively these results reveal molecular and neural-circuit mechanisms, illustrating how diverse pathologies may converge to drive behaviors relevant to psychiatric disorders.


Figures

Fig. 1
Fig. 1. Arp2/3 mutant mice respond to antipsychotics and exhibit elevated striatal dopamine
(a) Open field analysis of locomotor activity over time for Arp2/3 mutant (ArpC3f/f:CaMKIIαCre) or control (ArpC3f/f) mice given an (i.p.) vehicle (saline) or drug (haloperidol or clozapine) at 60 min (arrow) (n=12–21). (b) Cumulative distance moved per hour for each condition from (a). (*ps<0.05; two-way repeated-measures ANOVA followed by post-hoc tests) (c) HPLC-EC analysis of dopamine (DA) and its metabolites [3,4-dihydroxypheylacetic acid (DOPAC) and homomovanallic acid (HVA)], and serotonin (5-HT) from the ventral striatum of Arp2/3 mutant (n=7) and control mice (n=6) (*ps<0.05; independent t-tests). (d to g) Golgi stain analysis of dendritic spine density from the ventral striatum (d & e) and frontal cortex (FC) (f & g) of Arp2/3 mutant and control mice (n=3 for each group). Representative images (d & f) and average density (e & g) are shown (*p<0.001; independent t-test). Data are presented as mean ±SEM.
Fig. 2
Fig. 2. Regional rescue implicates the frontal cortex in mediating the elevated motor activity and striatal dopaminergic tone of the Arp2/3 mutant mice
(a) Schematic representation of the Cre-dependent ArpC3-expressing rescue adeno-associated virus (AAV). (b) Illustration representing the selective re-expression of ArpC3 and GFP in CaMKIIαCre positive neurons. Bottom image shows the extent of expression in forebrain from a single injection. (c to f) Analysis of open field activity following bilateral rescue of Arp2/3 activity in the frontal cortex. (c) Mean distance traveled every 5 min for ArpC3f/f(WT) (gray line; n=18), ArpC3f/f:CaMKIIαCre-GFP (cKO-control; bilateral GFP virus) (orange line; n=11), and ArpC3f/f:CaMKIIαCre-ArpC3 (cKO-rescue; bilateral ArpC3 virus) (green line; n=15) mice. (d) Cumulative distance (*p<0.01), (e) vertical activity (*p<0.05), and (f) stereotypical (*p<0.05) behavior for WT (gray bar), cKO-control (orange bar), and cKO-rescue (green bar) mice (One-way ANOVAs followed by post-hoc tests). (g) Representative image shows the placement of microdialysis probes. (h) Mean extracellular levels of dopamine in ventral striatum of WT (gray bar; n=6), cKO-control (orange bar; n=6), and cKO-rescue mice (green bar; n=6) (*ps<0.05; one-way ANOVA followed by post-hoc tests). (i) Plot of percent rotational movement for 30 min ipsilateral (blue line) versus contralateral (gray line) to the unilateral rescue of ArpC3 in the Arp2/3 mutant mice (n=7) before (−30 min) (*p<0.005) and after amphetamine injection (0–30 and 30–60 min) (**ps<0.0001). (j) Percentage of rotational movement for either left or right FC rescue mice for 90 min. All data are presented as mean ±SEM.
Fig. 3
Fig. 3. Arp2/3 rescued excitatory neurons of the frontal cortex project to and make synaptic contacts within the VTA/SNc
(a) Schematic representation of the rescue virus (Flex-AAV-ArpC3-2A-GFP) injection into the frontal cortex (FC). (b) Representative sagittal section image of GFP (green) expression and immunostaining for tyrosine hydroxylase (red) from an Arp2/3 frontal cortical rescue mouse. Boxes represent higher magnification images in (c). (c) High magnification images tracing the GFP positive neurons and their afferents from the FC all the way to the ventral tegmental area (VTA)/substantia nigra (SNc). (d) Representative maximum projection image with orthogonal views of GFP positive axons (green) and tyrosine hydroxylase immunohistochemistry (red) within the VTA/SNc. GFP within axons is from an ArpC3f/f: CaMKIIαCre mouse with Flex-AAV-ArpC3-2A-GFP virus injected into the FC. (e) High magnification surface rendering depicting contact between FC axons and tyrosine hydroxylase positive neurons within the VTA/SNc. (f and g) Schematic representation of the retrograde viral tracing between the VTA/SNc and FC. (h) Representative sagittal section visualizing Cre-dependent GFP expression in the FC mediated by a Cre-expressing rabies/lenti-viral injection (Lenti-FuGB2-Cre) into the VTA/SNc. Boxes represent higher magnification images in (i). Inset shows GFP-positive neurons from a FC section stained with DAPI (blue) and NeuroTrace® (red) to visualize the cortical layers. CC, corpus callosum. (i) High magnification images tracing the GFP positive neurons and their afferents from the FC all the way to the VTA/SNc. (j) Representative maximum projection image of GFP positive axons (green) labeled by retrograde lenti-FuGB2-Cre tracing from the VTA/SNc. Vglut1 and tyrosine hydroxylase immunohistochemistry labels dopamine-producing neurons (red) and presynaptic terminals (white). (k) High magnification view of co-localized axons (green), excitatory presynaptic marker (white) and dopamine neurons (red) within the VTA/SNc. All representative images were successfully repeated more than three times.
Fig. 4
Fig. 4. Loss of Arp2/3 function leads to the formation of abnormal synaptic contacts
(a) Schematic illustrating three types of asymmetric synaptic contacts observed in the Arp2/3 mutant mice. (b) Graph showing mean numbers of three types of synapses in control (ArpC3f/f; grey; n=70 micrographs from 3 mice) and cKO (ArpC3f/f:CaMKIIαCre; blue; n=75 micrographs from 3 mice) mice (independent t-test, *p<0.0001). (c) Electron micrographs of asymmetric synapses (marked by arrowheads) making direct contact with dendritic shafts (brown) in the frontal cortex of Arp2/3 mutant mice. (d) Serial electron micrographs (left) depicting an example of a reconstructed double axonal spine in the frontal cortex of Arp2/3 mutant mouse. sp; spine, d; dendrite, PSD; post-synaptic density. *ps<0.0001. N.D.= not detected. Data are presented as mean ±SEM.
Fig. 5
Fig. 5. Spine loss leads to excitation of the cortico-VTA/SNc circuit in Arp2/3 mutant mice
(a) Schematic representation of the labeling approach to generate cKO (Flex-AAV-GFP) versus rescue (Flex-AAV-ArpC3-2A-GFP) frontal cortical (FC) to VTA/SNc neurons. (b) Representative reconstructions from FC dendrites of cKO-GFP (control) versus cKO-ArpC3-2A-GFP (rescue) neurons at either 10 days after infection (top panels, 10 DAI) or 30 days after infection (bottom panels, 30 DAI). (c) Quantification of spine density after rescue, compared to control [n=16 (10 DAI-control; orange bar), n=14 (10 DAI-rescue; blue bar), n=19 (30 DAI-control; red bar), n=13 (30 DAI-rescue; green bar)] (*p<0.0001; two-way ANOVA followed by post-hoc tests). (d) Diagram depicting the patch clamp strategy from either GFP-positive neurons that are either control (cKO-GFP) or rescue hemisphere (cKO-ArpC3-2A-GFP) using the labeling strategy of (a). Representative image shows an Alexa Fluor®488 filled pipette patching onto a GFP-positive neuron (bottom panel). (e) Representative mEPSC traces of GFP-positive WT neurons, cKO neurons (cKO-GFP), or cKO neurons rescued with ArpC3 (cKO-ArpC3-2A-GFP). Top traces are from 10 DAI, bottom traces are from 30 DAI. (f–g) Box-and-Whisker graphs summarizing the mEPSC amplitude (f) and frequency (g). [n=9 (10 DAI-WT; black dots), n=10 (10 DAI-control; orange dots), n=10 (10 DAI-rescue; blue dots), n=15 (30 DAI-control; red dots), n=15 (30 DAI-rescue; green dots)] (*ps<0.001; two-way ANOVA followed by post-hoc tests). Data are presented as mean ±SEM.
Fig. 6
Fig. 6. Selective activation of the cortico-VTA/SNc circuit in wildtype mice stimulates haloperidol-sensitive locomotion and elevates dopamine within the striatum
(a) Schematic representation of the optogenetic stimulation strategy for activating the frontal cortical to VTA/SNc projections. (b) Representative schematic of the movement tracking system and image of an experimental mouse showing the onset of bilateral 473nm light stimulation. (c) Graph of distances moved (fold over baseline) over time in ChR2-expressing mice (blue circles; n=10) and in opsin-free-expressing control mice (gray circles; n=4). Blue area represents period of stimulation with 473nm light (10 ms pulse width, 30 Hz, 5 mW). (d) Distance moved (fold over baseline) in ChR2-expressing mice during the first minute of light stimulation (blue bar) versus that of opsin-free controls (grey bar) (independent t-test;*p<0.05). (e) Graph of distance moved (fold over baseline) over time for WT mice treated with vehicle (orange circles) or 0.2mg/kg haloperidol (green circle). Blue area represents period of stimulation as in (c). (f) Distance moved (fold over baseline) during the first minute of light stimulation for vehicle (orange bar; n=7) versus haloperidol-treated (green bar; n=7) mice (independent t-test;*p<0.05). (g) Schematic representation of the optogenetic stimulation strategy for stimulating the frontal cortical axons within the VTA/SNc while simultaneously measuring dopamine levels in the ventral striatum. Time schedule of the experiment is presented below. (h) Schematic representation (top panel) corresponding to the high magnification confocal images showing the expression of ChR2-YFP from the frontal cortex (FC) all the way to the VTA/SNc. HTH, hypothalamus. (i) Percent differences from baseline (monoamine levels before activation) of extracellular levels of striatal dopamine (DA) and its metabolites (DOPAC, HVA) after optogenetic stimulation (gray bar, opsin-free controls; n=10) (blue bar, ChR2; n=13) (independent t-test;*ps<0.05). Data are presented as percent mean ±SEM.

Comment in

References

    1. Purcell SM, et al. A polygenic burden of rare disruptive mutations in schizophrenia. Nature. 2014;506:185–190. - PMC - PubMed
    1. Lee SH, et al. Estimating the proportion of variation in susceptibility to schizophrenia captured by common SNPs. Nat Genet. 2012;44:247–250. - PMC - PubMed
    1. Malhotra D, Sebat J. CNVs: harbingers of a rare variant revolution in psychiatric genetics. Cell. 2012;148:1223–1241. - PMC - PubMed
    1. Stergiakouli E, et al. Investigating the contribution of common genetic variants to the risk and pathogenesis of ADHD. Am J Psychiatry. 2012;169:186–194. - PMC - PubMed
    1. McCarroll SA, Hyman SE. Progress in the genetics of polygenic brain disorders: significant new challenges for neurobiology. Neuron. 2013;80:578–587. - PMC - PubMed

Publication types

MeSH terms

LinkOut - more resources