. 2015 Jun 10;15(6):4194-9.
doi: 10.1021/acs.nanolett.5b01396. Epub 2015 May 18.

Precise Three-Dimensional Scan-Free Multiple-Particle Tracking over Large Axial Ranges with Tetrapod Point Spread Functions

Affiliations

Precise Three-Dimensional Scan-Free Multiple-Particle Tracking over Large Axial Ranges with Tetrapod Point Spread Functions

Yoav Shechtman et al. Nano Lett. .

Abstract

We employ a novel framework for information-optimal microscopy to design a family of point spread functions (PSFs), the Tetrapod PSFs, which enable high-precision localization of nanoscale emitters in three dimensions over customizable axial (z) ranges of up to 20 μm with a high numerical aperture objective lens. To illustrate, we perform flow profiling in a microfluidic channel and show scan-free tracking of single quantum-dot-labeled phospholipid molecules on the surface of living, thick mammalian cells.

Keywords: 3D imaging; PSF engineering; nanoscopy; single particle tracking; single-molecule imaging; super-resolution microscopy.


Figures

Figure 1
Figure 1
Experimental implementation of a 4f optical processing system. The PSF is modified by a phase mask (or spatial light modulator) placed in the Fourier plane.
Figure 2
Figure 2
Tetrapod masks, optimized for z-ranges of 6 μm (a–d) and 20 μm (e–h). Tetrapod phase patterns designed for 6 μm and 20 μm (a,e). Numerical PSF calculation for various z-positions (b,f) and experimentally measured bead images (c,g), each image normalized by maximum intensity. (d,h) Numerically calculated precision, defined as (CRLB)1/2 for x, y, and z determination, using 3500 signal photons on a background of 50 mean photons per pixel.
Figure 3
Figure 3
Microfluidic channel setup. Water with fluorescent beads (200 nm diameter, 625 nm absorption/645 nm emission) is flowing through a microchannel, placed on top of a microscope objective of an inverted microscope. As the beads flow, they are excited by a laser (641 nm), and their fluorescence signal is captured. Two beads are illustrated.
Figure 4
Figure 4
Laminar flow measurement. (a) Example raw frame, showing three emitters at different x, y, z positions, flowing in the x-direction. (b) Experimentally derived two-dimensional mean vx map, averaged over x (yz cross-section). (c,d) One-dimensional slices from (b), showing mean vx, vy, and vz velocities. As predicted by a laminar flow model, vx (black) has a parabolic profile, whereas vy and vz (blue, red) are negligible by comparison. Error bars represent ±1 s.d.
Figure 5
Figure 5
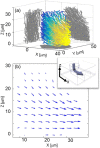
Three-dimensional flow measurement. (a) Three-dimensional flow trajectories of a 100-bead subset at the entrance facet of the microfluidic channel (see inset in (b)), color-coded by normalized trajectory duration (blue, start; yellow, end). Typical trajectory duration ∼1.5 s. (b) An xz slice. The flow is profiled over ∼30 μm in z. The data is binned in 3 × 3 × 3 μm3xyz bins, arrow length linearly encodes velocity (longest arrow corresponds to 22.5 μm/s).
Figure 6
Figure 6
Long-term 3D tracking of a Qdot-labeled PE lipid on the surface of a live HeLa cell. (a) Brightfield impression with overlaid fluorescence channel (one 50 ms frame), showing signal from a quantum-dot-labeled PE lipid. Scale bar: 10 μm. (b) Inferred 3D trajectory as a function of time (55 s total), color-coded with time progression, and planar projections of the motion shown in gray on each of the bounding surfaces. The total motion over an axial range of 5.67 μm is mapped. Maximum-likelihood estimation on a frame-by-frame basis produces the trajectory. Measured fluorescence data is given in Supporting Information Movie 5.

References

    1. Dupont A.; Lamb D. C. Nanoscale 2011, 3, 4532–4541. - PubMed
    1. Gelles J.; Schnapp B. J.; Sheetz M. P. Nature 1988, 331, 450–453. - PubMed
    1. Qian H.; Sheetz M. P.; Elson E. L. Biophys. J. 1991, 60, 910–921. - PMC - PubMed
    1. Saxton M. J.; Jacobson K. Annu. Rev. Biophys. Biomol. Struct. 1997, 26, 373–399. - PubMed
    1. Fujiwara T.; Ritchie K.; Murakoshi H.; Jacobson K.; Kusumi A. J. Cell Biol. 2002, 157, 1071–1081. - PMC - PubMed

Publication types

Substances