. 2015 Aug;26(7-8):314-24.
doi: 10.1007/s00335-015-9563-1. Epub 2015 May 5.

GXD: a community resource of mouse Gene Expression Data

Affiliations

GXD: a community resource of mouse Gene Expression Data

Constance M Smith et al. Mamm Genome. 2015 Aug.

Abstract

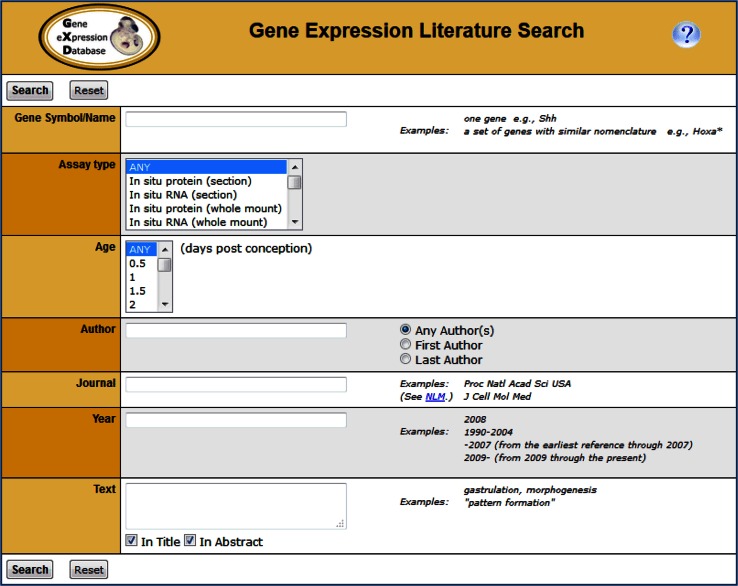
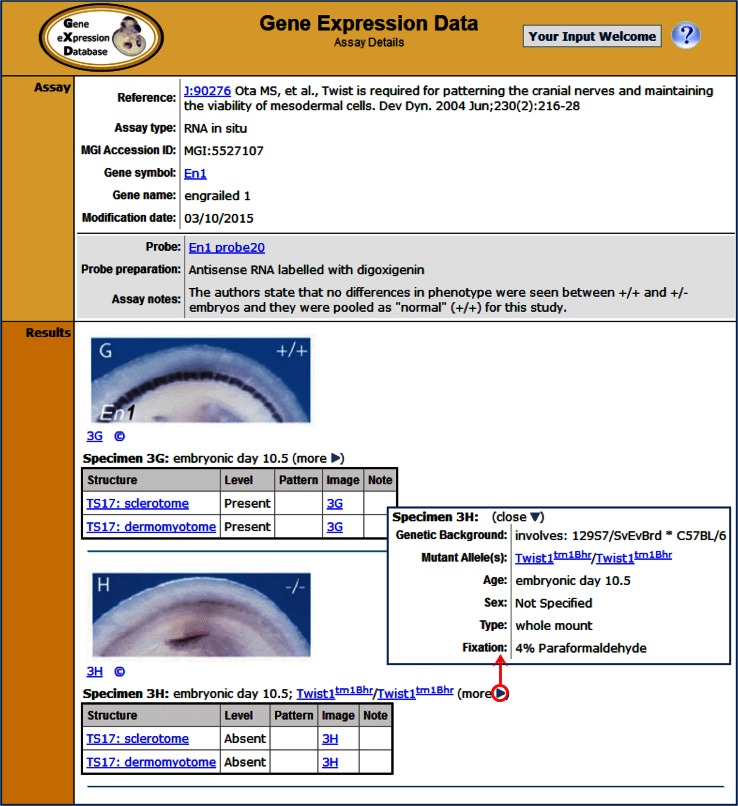
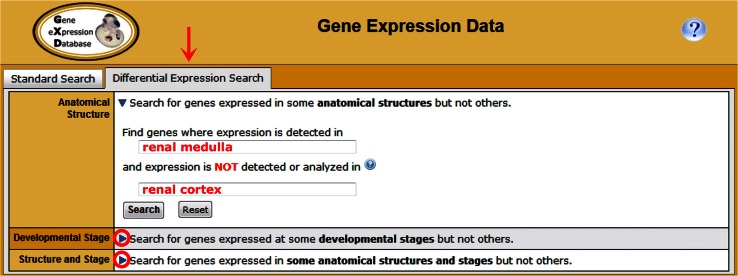
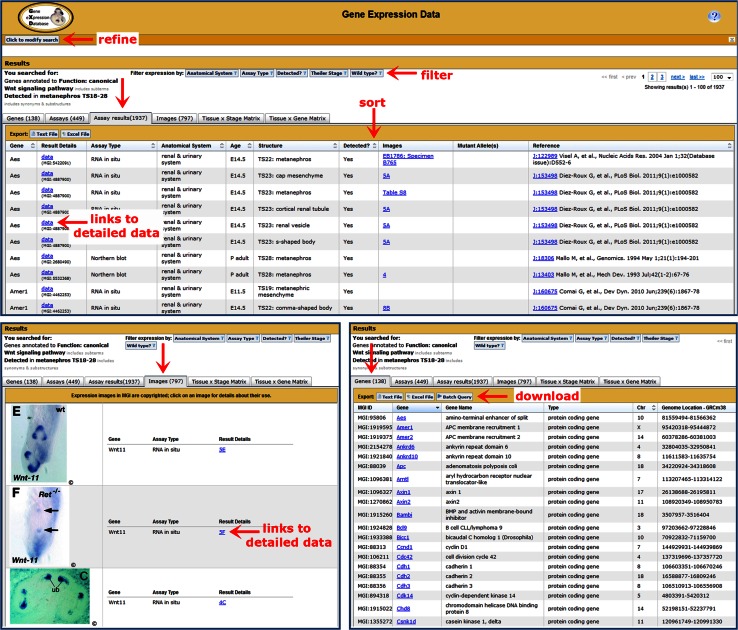
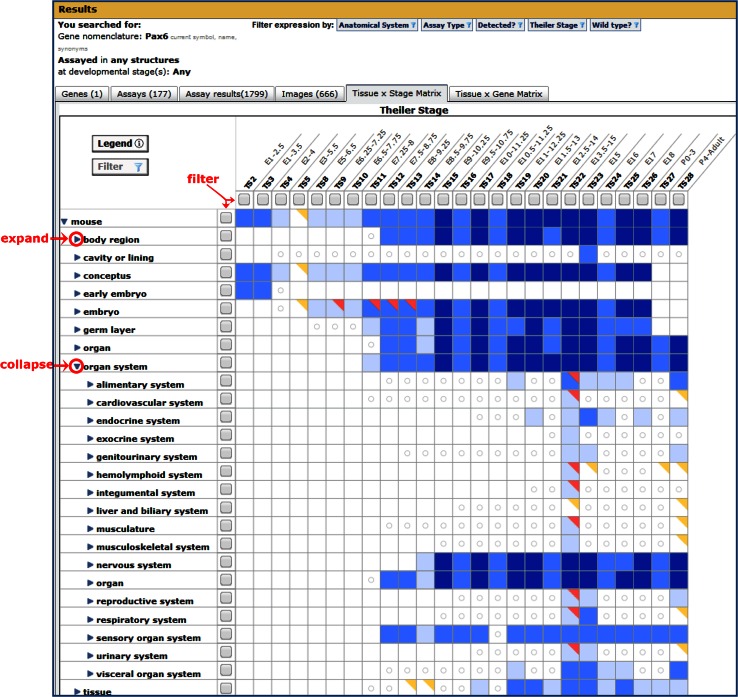
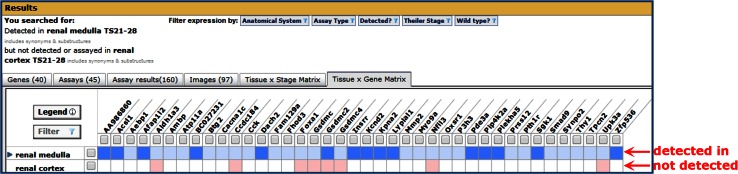
The Gene Expression Database (GXD) is an extensive, easily searchable, and freely available database of mouse gene expression information (www.informatics.jax.org/expression.shtml). GXD was developed to foster progress toward understanding the molecular basis of human development and disease. GXD contains information about when and where genes are expressed in different tissues in the mouse, especially during the embryonic period. GXD collects different types of expression data from wild-type and mutant mice, including RNA in situ hybridization, immunohistochemistry, RT-PCR, and northern and western blot results. The GXD curators read the scientific literature and enter the expression data from those papers into the database. GXD also acquires expression data directly from researchers, including groups doing large-scale expression studies. GXD currently contains nearly 1.5 million expression results for over 13,900 genes. In addition, it has over 265,000 images of expression data, allowing users to retrieve the primary data and interpret it themselves. By being an integral part of the larger Mouse Genome Informatics (MGI) resource, GXD's expression data are combined with other genetic, functional, phenotypic, and disease-oriented data. This allows GXD to provide tools for researchers to evaluate expression data in the larger context, search by a wide variety of biologically and biomedically relevant parameters, and discover new data connections to help in the design of new experiments. Thus, GXD can provide researchers with critical insights into the functions of genes and the molecular mechanisms of development, differentiation, and disease.


Figures

Fig. 1
Fig. 1
The Gene Expression Literature Search (http://www.informatics.jax.org/gxdlit) allows researchers to quickly find publications in the mouse embryonic expression literature. Users can search for genes and ages analyzed and expression assay types used, as well as by bibliographic information or specific words in the title or abstract
Fig. 2
Fig. 2
Assay Details pages reveal the detailed content of GXD’s expression records. A record for a RNA in situ experiment is shown. The Assay section reports the reference from which the data were derived, the assay type, the gene analyzed, and the probe used, with links to more details about each. The Results section reports the tissue (Theiler stage and anatomical structure) analyzed, as well as the level and pattern of expression. Images of the original expression data are displayed together with the corresponding annotations whenever possible. Major specimen details such as the age and mutant alleles are always displayed on this page; other information is accessible by means of the “more” toggle (circled)
Fig. 3
Fig. 3
The Gene Expression Data Query Form (http://www.informatics.jax.org/gxd) features two search tabs: Standard and Differential Expression. The Standard Search (above) provides the most flexibility, allowing querying of expression data using the parameters of most interest. The Genes section allows searching by a specific gene or for a set of genes based on their function [as defined by Gene Ontology terms (Gene Ontology Consortium 2015)]; their association with mouse phenotypes [as defined by Mammalian Phenotype Ontology terms (Smith and Eppig 2012)]; or their association with human diseases [as defined by Online Mendelian Inheritance in Man (OMIM) terms (Amberger et al. 2015)]. The Genome location section makes it possible to limit expression searches to genes located in a particular chromosomal region, which is useful when hunting for candidate genes. The Anatomical structure or stage section allows searching for expression data in specific anatomical structures and/or developmental (Theiler) stages or ages. Anatomical searches take advantage of the hierarchy of the anatomy ontology, returning annotations to substructures as well as to the structure itself. The Mutant/wild-type section can be used to limit the searches to expression data from wild-type mice or from specific mutants. The Assay types section allows for the selection of desired expression data types. Auto-fill functionality helps to find appropriate search terms. The illustrated search is “Which canonical Wnt signaling genes have been studied in the kidney?” Figure 5 shows the corresponding search results pages
Fig. 4
Fig. 4
The Differential Expression Search on the Gene Expression Query Form allows searching for genes that are expressed in some anatomical structures but not others and/or at some developmental stages but not others. To facilitate these searches, the form has been divided into three sections; each is optimized for entry of different combinations of anatomical structures and/or developmental stages. One section is expanded in the illustration; the other two may be expanded using the toggles (circles). The illustrated search asks, “Which genes are expressed in renal medulla but not renal cortex?” Figure 7 shows part of those search results
Fig. 5
Fig. 5
Gene Expression Data searches return summaries for the expression results that match the search parameters, organized under six separate tabs. Each summary presents the data with a different level of detail and focus. The number of matching records is indicated in the tab header. The Assay results tab (upper) is displayed by default. It lists the gene studied, the assay type used, the anatomical system, age and tissue examined, indicates whether expression was detected, provides a link to the corresponding images, lists the mutant alleles of the specimen (if applicable), and provides the reference from which the data were derived. Links in the Result Details and Images columns lead to detailed expression records, such as the one shown in Fig. 2. Arrowheads in column headers indicate that the column is sortable (one set is indicated). The Assay results tab (as well as the Genes tab) allows for export of results in text and spread sheet formats (buttons in table header). The Images tab (lower left) shows all the images that match the search criteria, together with the gene(s) examined in that image and the assay type used and provides a link to the corresponding part of the detailed expression record. The Genes tab (lower right) provides a list of the genes that match the query. The export feature can forward the genes list to either the MGI batch query or MouseMine, thereby allowing searches for additional information, such as the function, phenotype and/or disease terms associated with the genes of interest. Expression summaries can be refined using the “Click to modify search” button or using the filter options provided on the summary page. The content of all of the summaries will change accordingly. To filter by anatomical structures or by gene, use the row and column filters available on the Tissue × Stage Matrix (Fig. 6) or Tissue × Gene Matrix (Fig. 7) respectively
Fig. 6
Fig. 6
The Tissue × Stage Matrix on GXD search summaries provides a spatial and temporal overview of search results. The matrix columns show the Theiler stages where expression was examined, and the rows display the tissues that were examined. Clicking on the toggles (circled) expands (or collapses) the anatomy hierarchy. Results can be refined by tissue and developmental stage using the gray check boxes (arrows) to filter the search results. The colors in the matrix cells indicate the type of annotations: blue for presence of expression and red for absence of expression. The cell colors get progressively darker when there are more supporting annotations; an online legend details the number of annotations represented by each color. Cells with a red corner indicate that expression has been reported as being both present and absent in that tissue. Although this may be because different laboratories made conflicting observations, it is more likely to be due to other factors such as: differences in the genotype or sex of the specimen; sensitivity of the assay used; or a difference in the transcript variant assayed. A cell with a gold corner indicates that there are expression results for substructures of the tissue that were reported as being either absent or ambiguous. A circle in a cell indicates the tissue exists at that developmental stage but GXD has no expression data for it, whereas a blank cell indicates that the tissue does not exist at that stage. To access the data for specific tissue by stage combinations, click the cell to open a pop-up. It displays a table with more details about the annotations and has buttons which, by acting as a filter, will allow viewing of those annotations in either the Assay results or Images tab (Fig. 5)
Fig. 7
Fig. 7
The Tissue × Gene Matrix tab on GXD search summaries enables the comparison of expression patterns of different genes. The matrix columns show genes whose expression was examined, and the rows display the tissues that were examined. By using the gray check boxes to filter the search results, the matrix also allows for refinement of search results by gene, as well as tissue. Most of the cell coloring conventions are the same as those for the Tissue × Stage Matrix, as described in Fig. 6, with the exception that in this matrix the white cells indicate there are no annotations in the database. The Tissue × Gene Matrix is especially useful when interpreting the return for Differential Expression searches (Fig. 4). This figure shows the matrix generated by a search for genes expressed in the renal medulla but not detected or assayed in renal cortex. The matrix makes it immediately clear which genes have been examined and shown not to be expressed in the renal cortex (red cells) and those for which there is no expression information about the renal cortex in GXD (white cells), either because these results have not been reported in the literature or because they have not yet been recorded in GXD

References

    1. Amberger JS, Bocchini CA, Schiettecatte F, Scott AF, Hamosh A. OMIM.org: Online Mendelian Inheritance in Man (OMIM®), an online catalog of human genes and genetic disorders. Nucleic Acids Res. 2015;43:D789–D798. doi: 10.1093/nar/gku1205. - DOI - PMC - PubMed
    1. Barrett T, Wilhite SE, Ledoux P, Evangelista C, Kim IF, Tomashevsky M, Marshall KA, Phillippy KH, Sherman PM, Holko M, Yefanov A, Lee H, Zhang N, Robertson CL, Serova N, Davis S, Soboleva A. NCBI GEO: archive for functional genomics data sets–update. Nucleic Acids Res. 2013;41:D991–D995. doi: 10.1093/nar/gks1193. - DOI - PMC - PubMed
    1. Bult CJ, Kadin JA, Richardson JE, Blake JA, Eppig JT, Mouse Genome Database Group The Mouse Genome Database: enhancements and updates. Nucleic Acids Res. 2010;38:D586–D592. doi: 10.1093/nar/gkp880. - DOI - PMC - PubMed
    1. Diez-Roux G, Banfi S, Sultan M, Geffers L, Anand S, Rozado D, Magen A, Canidio E, Pagani M, Peluso I, Lin-Marq N, Koch M, Bilio M, Cantiello I, Verde R, De Masi C, Bianchi SA, Cicchini J, Perroud E, Mehmeti S, Dagand E, Schrinner S, Nürnberger A, Schmidt K, Metz K, Zwingmann C, Brieske N, Springer C, Hernandez AM, Herzog S, Grabbe F, Sieverding C, Fischer B, Schrader K, Brockmeyer M, Dettmer S, Helbig C, Alunni V, Battaini MA, Mura C, Henrichsen CN, Garcia-Lopez R, Echevarria D, Puelles E, Garcia-Calero E, Kruse S, Uhr M, Kauck C, Feng G, Milyaev N, Ong CK, Kumar L, Lam M, Semple CA, Gyenesei A, Mundlos S, Radelof U, Lehrach H, Sarmientos P, Reymond A, Davidson DR, Dollé P, Antonarakis SE, Yaspo ML, Martinez S, Baldock RA, Eichele G, Ballabio A. A high-resolution anatomical atlas of the transcriptome in the mouse embryo. PLoS Biol. 2011;9:e1000582. doi: 10.1371/journal.pbio.1000582. - DOI - PMC - PubMed
    1. Eppig JT, Blake JA, Bult CJ, Kadin JA, Richardson JE, Mouse Genome Database Group The Mouse Genome Database (MGD): facilitating mouse as a model for human biology and disease. Nucleic Acids Res. 2015;43:D726–D736. doi: 10.1093/nar/gku967. - DOI - PMC - PubMed

Publication types

Substances

LinkOut - more resources