. 2015 Jul;78(7):587-98.
doi: 10.1002/jemt.22512. Epub 2015 May 4.

An automated imaging system for radiation biodosimetry

Affiliations

An automated imaging system for radiation biodosimetry

Guy Garty et al. Microsc Res Tech. 2015 Jul.

Abstract

We describe here an automated imaging system developed at the Center for High Throughput Minimally Invasive Radiation Biodosimetry. The imaging system is built around a fast, sensitive sCMOS camera and rapid switchable LED light source. It features complete automation of all the steps of the imaging process and contains built-in feedback loops to ensure proper operation. The imaging system is intended as a back end to the RABiT-a robotic platform for radiation biodosimetry. It is intended to automate image acquisition and analysis for four biodosimetry assays for which we have developed automated protocols: The Cytokinesis Blocked Micronucleus assay, the γ-H2AX assay, the Dicentric assay (using PNA or FISH probes) and the RABiT-BAND assay.

Keywords: dicentrics; fluorescence microscopy; mBAND; micronuclei; sCMOS; γ-H2AX.


Conflict of interest statement

Conflict of Interest

Some of the reagents, equipment and plasticware used in this work were purchased through Fisher Scientific. At the time of writing this manuscript GG owns 90 shares of Thermo Fisher Scientific stock. The Authors report no other potential conflicts.

Figures
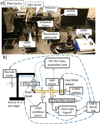
Figure 1
Figure 1
a) Photo and b) schematic diagram of the imaging system. Each box represents a single peripheral device. Dashed thick lines correspond to RS232 communications. Thin solid lines correspond to analog control. The arrows denote the direction of communication. Thick arrows represent motion. Hashed shapes represent optics (the lenses marked with * are tube lenses (200 mm Nikon Tube lens, Edmund optics, Barrington, NJ, USA). The dichroic mirror marked with † is a custom quad-band dichroic mirror (475/525/600/690 QBDR, Omega Optical, Inc., Brattleboro, VT). The dichroic mirror marked with a ‡ is an infrared mirror which is part of the CRISP autofocus system.
Figure 2
Figure 2
Forms available in the control software.The solid arrows denote actuating a control in another form. The dashed arrows denote data transfer. The text overlayed on the dashed arrows indicate the type of data transferred.
Figure 3
Figure 3
Error value of the CRISP unit as function of objective lens position above or below focus. The dashed line corresponds to our 20× lens. The solid line, stitched from 4 overlapping 100 µm scans, corresponds to the 60× lens.
Figure 4
Figure 4
Comparative spectra of the 6 independently controlled LEDs in the SOLA light engine® (solid lines) and an EXFO 120PC Hg lamp (dashed line, bulb timer: 1002 h), measured under identical conditions using an SPM-002-C spectrometer (Photon Control Inc.)
Figure 5
Figure 5
Image obtained from one-color micronucleus assay in a multiwell plate. Binucleated cells and a micronucleus are visible within one 40× frame (1776×1760 pixels).
Figure 6
Figure 6
γ-H2AX foci imaged at different magnifications. The top row shows a full frame image (1776×1760). The number of cells scored from each image is indicated. The bottom row shows a 10× magnification of the region indicated in the images in the top row. The red channel corresponds to the AF-555-tagged γ-H2AX antibody. The blue channel to the DAPI counterstain.
Figure 7
Figure 7
Example of Dicentric analysis using FISH probes. Chromosomes are stained with a centromeric probe (green) and telemetric probe (red) and counterstained with DAPI. a) False color image generated by the imaging system (cropped and rotated to match up with the other panels). An acentric fragment is circled. b) Cropped images of the two chromosomes indicated in a). c) Intensity profile along each of the two chromosomes.
Figure 8
Figure 8
Example of MBAND analysis. A) False color image generated in ImageJ from the images captured by the imaging system. b) Example of the band structure of a normal chromosome and c) of a chromosome with an inversion due to a 2 Gy neutron irradiation – the order of the bands highlighted is reversed. The arrows denote the position of the centromere, between the DEAC and Texas Red bands.
Figure 9
Figure 9
γ-H2AX yields as a function of distance from focus for different lenses.
Figure 10
Figure 10
a) Full frame image of a uniform fluorescence test slide – the dashed line denotes the 1776×1760 frame used in all images above. b) Image of a field of nuclei (only top right quadrat of image is shown) without gain correction. c) The same image with gain correction. Note that cells in image periphery (top and right) are much brighter than in 10b.

References

    1. Böcker W, Iliakis G. Computational Methods for Analysis of Foci: Validation for Radiation-Induced γ-H2AX Foci in Human Cells. Radiation Research. 2006;165(1):113–124. - PubMed
    1. Bueno G, Déniz O, Fernández-Carrobles MDM, Vállez N, Salido J. An automated system for whole microscopic image acquisition and analysis. Microscopy Research and Technique. 2014;77(9):697–713. - PubMed
    1. Chen Y, Zhang J, Wang H, Garty G, Xu Y, Lyulko OV, Turner HC, Randers-Pehrson G, Simaan N, Yao YL, Brenner DJ. Design and preliminary validation of a rapid automated biosodimetry tool for high throughput radiological triage. Proc ASME. 2009;3:61–67. - PMC - PubMed
    1. Chen Y, Zhang J, Wang H, Garty G, Xu Y, Lyulko OV, Turner HC, Randers-Pehrson G, Simaan N, Yao YL, Brenner DJ. Development of a Robotically-based Automated Biodosimetry Tool for High-throughput Radiological Triage. International Journal of Biomechatronics and Biomedical Robotics. 2010;1(2):115–125.
    1. Chudoba I, Hickmann G, Friedrich T, Jauch A, Kozlowski P, Senger G. mBAND: a high resolution multicolor banding technique for the detection of complex intrachromosomal aberrations. Cytogenet Genome Res. 2004;104(1–4):390–393. - PubMed

Publication types

MeSH terms

LinkOut - more resources