. 2015 May 20;6(14):12094-109.
doi: 10.18632/oncotarget.3297.

From the core to beyond the margin: a genomic picture of glioblastoma intratumor heterogeneity

Affiliations

From the core to beyond the margin: a genomic picture of glioblastoma intratumor heterogeneity

Marc Aubry et al. Oncotarget. .

Erratum in

Abstract

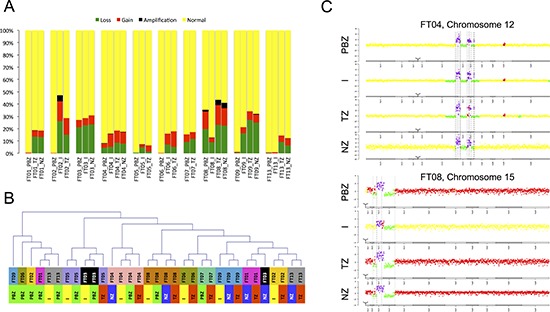
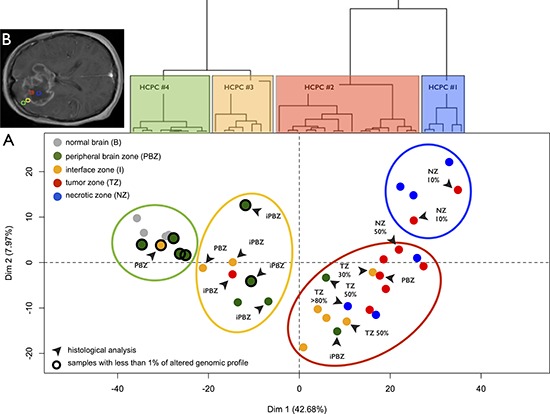
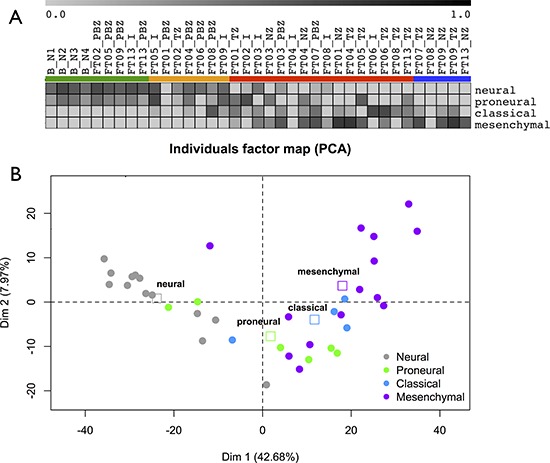
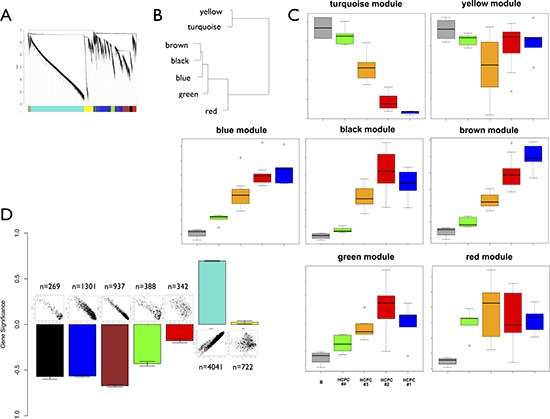
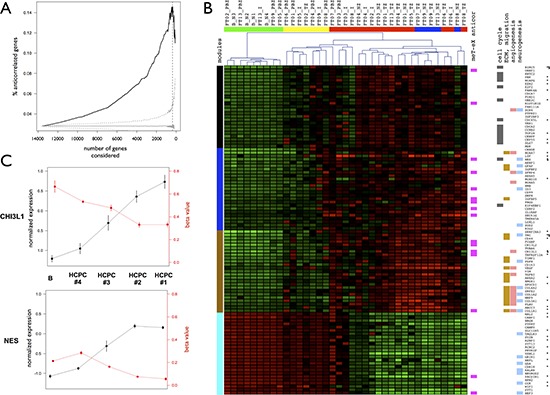
Glioblastoma (GB) is a highly invasive primary brain tumor that almost systematically recurs despite aggressive therapies. One of the most challenging problems in therapy of GB is its extremely complex and heterogeneous molecular biology. To explore this heterogeneity, we performed a genome-wide integrative screening of three molecular levels: genome, transcriptome, and methylome. We analyzed tumor biopsies obtained by neuro-navigation in four distinct areas for 10 GB patients (necrotic zone, tumor zone, interface, and peripheral brain zone). We classified samples and deciphered a key genes signature of intratumor heterogeneity by Principal Component Analysis and Weighted Gene Co-expression Network Analysis. At the genome level, we identified common GB copy number alterations and but a strong interindividual molecular heterogeneity. Transcriptome analysis highlighted a pronounced intratumor architecture reflecting the surgical sampling plan of the study and identified gene modules associated with hallmarks of cancer. We provide a signature of key cancer-heterogeneity genes highly associated with the intratumor spatial gradient and show that it is enriched in genes with correlation between methylation and expression levels. Our study confirms that GBs are molecularly highly diverse and that a single tumor can harbor different transcriptional GB subtypes depending on its spatial architecture.

Keywords: glioblastoma; integrative functional genomics; intratumor heterogeneity; invasion.


Conflict of interest statement

CONFLICTS OF INTEREST

The author(s) declare that they have no competing interests.

Figures

Figure 1
Figure 1. Genome profiling
A. Copy Number Alterations (type and percentage) detected in each sample (yellow: normal, green: loss, red: gain, black: amplification). Samples are grouped by patient. B. Samples classification based on CNAs profiles. PBZ: peripheral brain zone, I: interface, TZ: tumor zone, NZ: necrotic zone. C. Examples of patient specific and atypical alterations.
Figure 2
Figure 2. Transcriptome profiling
A. Principal Component Analysis (PCA) performed on the expression data for 41000 probes without a priori selection. Dots represent samples and are colored according to the neuro-navigation sampling: green (PBZ: peripheral brain zone), yellow (I: interface zone), red (TZ: tumor zone), and blue (NZ: necrotic zone). Gray dots represent normal brain reference samples. Dendrogram of the hierarchical clustering based on principal components (HCPC) is represented above the Individual factor map. HCPC clusters are represented on the factorial plan by colored ellipses reflecting the sampling plan of the study ‘from the core of the tumor to beyond the margin’: HCPC #4 (blue), HCPC #3 (red), HCPC #2 (yellow), and HCPC #1 (green). Samples with unaltered array-CGH profile are circled in black. Black arrows designate samples with non-concordant histological analysis (PBZ: non-infiltrated parenchyma, iPBZ: infiltrated parenchyma, I: interface, TZ x%: presence of a corresponding percentage of tumor cells, and NZ x%: presence of a corresponding percentage of necrotic cells). B. Areas for biopsy in the four GB zones defined on preoperative MRI: necrotic zone (blue), tumor zone (red), interface (yellow), and peripheral brain zone (green).
Figure 3
Figure 3. GB subtypes
A. Samples GB subtypes according to the Verhaak signature. Gene Set Enrichment Analysis enrichment scores of each samples are reported as a gray-based color gradient. B. Samples GB subtypes and zone-specific profiles determined by PCA. Samples are colored according to their GB subtype. Squares: barycenter of GB subtypes.
Figure 4
Figure 4. Weighted gene co-expression network analysis
A. Cluster dendrogram and co-expression modules. B. Clustering of module eigengenes. C. Module eigengenes expression across the sampling plan. Boxplots are colored according to HCPC classification. The gray boxplot represents reference control brain samples (n = 4). The green boxplot includes HCPC1 samples minus reference control brain samples. D. Gene significance (mean and standard error) for each module. Above each bar is a scatter plot of gene significance (GS) versus module membership (MM). GS is based on p-values from the ANOVA performed between HCPC clusters (BH corrected p-values). Number of probes in each module is also reported.
Figure 5
Figure 5. Anti-correlated genes and master genes signature
A. Percentages of anti-correlated genes between expression and methylation levels. Genes are ranked according to their importance in terms of contribution to the PCA data structure and percentages are calculated for subsets of genes ranging from the 100 most important genes to the whole dataset (x-axis). Black: observed percentage. Gray: significativity of the percentage of anti-correlated genes estimated by bootstrapping (n = 1000). Median (solid line) and CI 99% (dotted) are presented. Vertical dashed line: maximum percentage obtained for 370 genes. B. Master genes signature. Heatmap and samples hierarchical clustering for transcriptome data. Samples are colored by HCPC cluster (see Figure 2a for details). Genes functional insights are represented by cluster colors. Left: coexpression modules. Right: anti-correlation between methylation and expression levels, statistically enriched Gene Ontology functional categories. Validated differential expression are also reported (*: transcriptome data, tumor versus normal; $: RT-qPCR data, tumor zone versus peripheral brain zone). C. Normalized expression levels and methylation beta-values across HCPC clusters for CHI3L1 (brown module) and NES (blue module). Means +/− standard errors for each HCPC cluster with normal brain control samples set apart (see Figure 4C for details).

Similar articles

Cited by

References

    1. Dolecek TA, Propp JM, Stroup NE, Kruchko C. CBTRUS statistical report: primary brain and central nervous system tumors diagnosed in the United States in 2005–2009. Neuro Oncol. 2012;14:v1–49. - PMC - PubMed
    1. Wen PY, Kesari S. Malignant gliomas in adults. N Engl J Med. 2008;359:492–507. - PubMed
    1. Stupp R, Hegi ME, Mason WP, van den Bent MJ, Taphoorn MJ, Janzer RC, Ludwin SK, Allgeier A, Fisher B, Belanger K, Hau P, Brandes AA, Gijtenbeek J, Marosi C, Vecht CJ, Mokhtari K, et al. Effects of radiotherapy with concomitant and adjuvant temozolomide versus radiotherapy alone on survival in glioblastoma in a randomised phase III study: 5-year analysis of the EORTC-NCIC trial. Lancet Oncol. 2009;10:459–466. - PubMed
    1. Brennan CW, Verhaak RG, McKenna A, Campos B, Noushmehr H, Salama SR, Zheng S, Chakravarty D, Sanborn JZ, Berman SH, Beroukhim R, Bernard B, Wu CJ, Genovese G, Shmulevich I, Barnholtz-Sloan J, et al. The somatic genomic landscape of glioblastoma. Cell. 2013;155:462–477. - PMC - PubMed
    1. Bonavia R, Inda MM, Cavenee WK, Furnari FB. Heterogeneity maintenance in glioblastoma: a social network. Cancer Res. 2011;71:4055–4060. - PMC - PubMed

Publication types