. 2015 Nov;43(11):2722-34.
doi: 10.1007/s10439-015-1327-2. Epub 2015 May 5.

Modeling of Tracer Transport Delays for Improved Quantification of Regional Pulmonary ¹⁸F-FDG Kinetics, Vascular Transit Times, and Perfusion

Affiliations

Modeling of Tracer Transport Delays for Improved Quantification of Regional Pulmonary ¹⁸F-FDG Kinetics, Vascular Transit Times, and Perfusion

Tyler J Wellman et al. Ann Biomed Eng. 2015 Nov.

Abstract

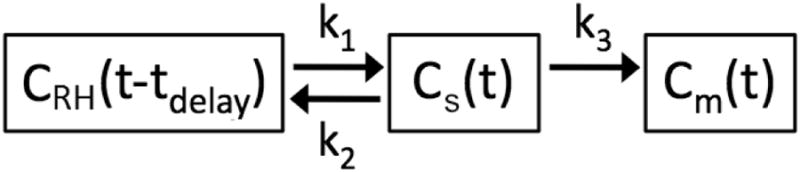
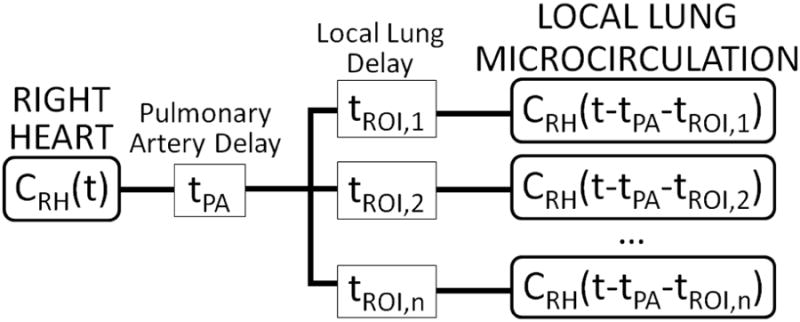
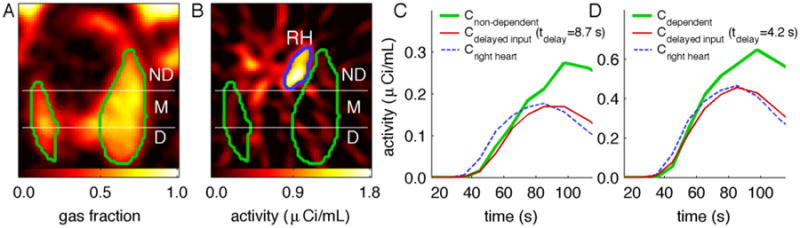
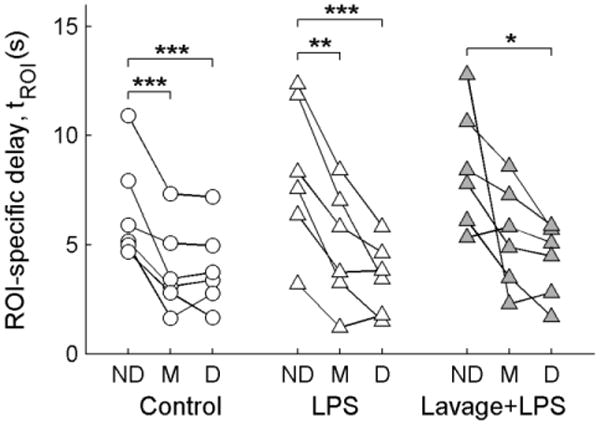
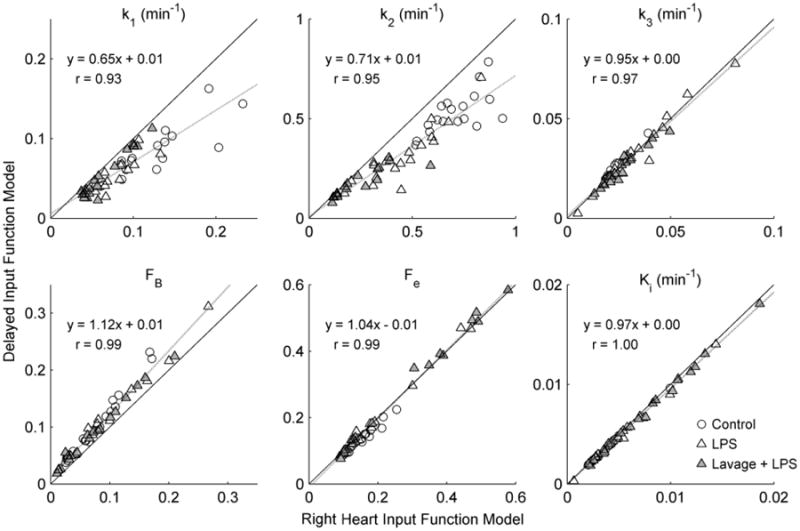
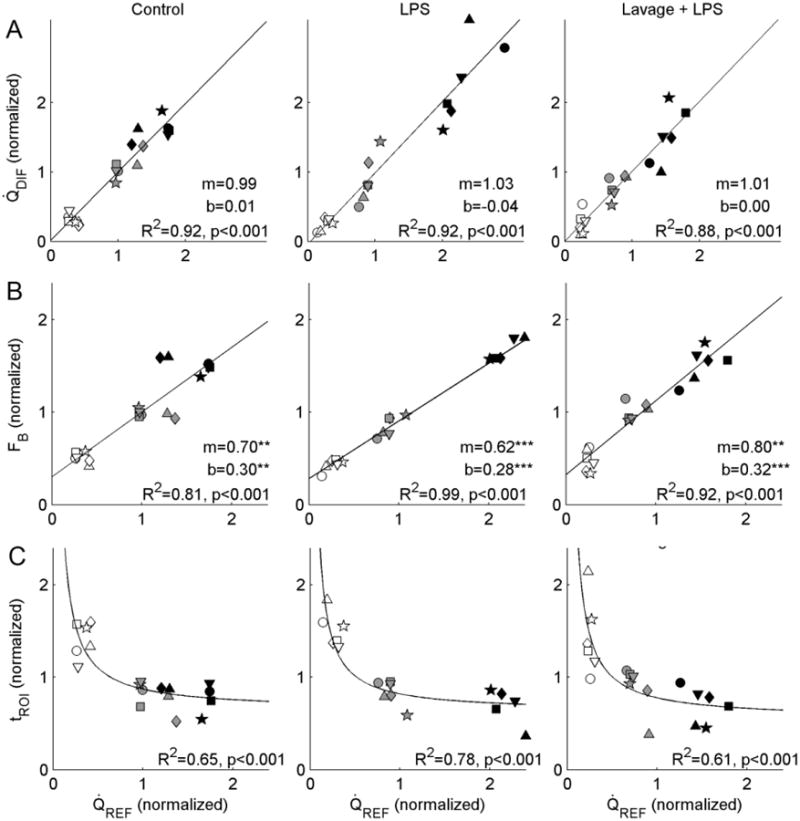
¹⁸F-FDG-PET is increasingly used to assess pulmonary inflammatory cell activity. However, current models of pulmonary ¹⁸F-FDG kinetics do not account for delays in ¹⁸F-FDG transport between the plasma sampling site and the lungs. We developed a three-compartment model of ¹⁸F-FDG kinetics that includes a delay between the right heart and the local capillary blood pool, and used this model to estimate regional pulmonary perfusion. We acquired dynamic ¹⁸F-FDG scans in 12 mechanically ventilated sheep divided into control and lung injury groups (n = 6 each). The model was fit to tracer kinetics in three isogravitational regions-of-interest to estimate regional lung transport delays and regional perfusion. ¹³NN bolus infusion scans were acquired during a period of apnea to measure regional perfusion using an established reference method. The delayed input function model improved description of ¹⁸F-FDG kinetics (lower Akaike Information Criterion) in 98% of studied regions. Local transport delays ranged from 2.0 to 13.6 s, averaging 6.4 ± 2.9 s, and were highest in non-dependent regions. Estimates of regional perfusion derived from model parameters were highly correlated with perfusion measurements based on ¹³NN-PET (R² = 0.92, p < 0.001). By incorporating local vascular transports delays, this model of pulmonary ¹⁸F-FDG kinetics allows for simultaneous assessment of regional lung perfusion, transit times, and inflammation.

Keywords: Capillary transit times; Plasma input function; Positron emission tomography; Tracer kinetics.


Figures

Fig. 1
Fig. 1
The delayed input function model used to describe regional lung 18F-FDG kinetics. Rate constants k1 and k2 describe the transfer of 18F-FDG between blood in the pulmonary capillary blood pool, whose activity is represented by a time delay of the right heart plasma concentration (CRH[t-tdelay]), and the extravascular substrate compartment (Cs[t]). The parameter tdelay, which is unique to this model, represents the time required for 18F-FDG to travel from the right heart to the local pulmonary capillary blood pool, while k3 describes the rate of transfer into the metabolized compartment (Cm[t]), representing intracellular phosphorylation of 18F-FDG. The fractional blood volume (FB, not shown) is an additional model parameter
Fig. 2
Fig. 2
Schematic of time delays in 18F-FDG transport between the right heart and the local lung microcirculation (i.e., capillary blood pool). 18F-FDG activity vs. time in the right heart, CRH(t), is measured using dynamic imaging of a region-of-interest (ROI) drawn over the right heart. We included a common delay in 18F-FDG transport associated with transit through the pulmonary artery (tPA), as well as local delays specific to each ROI i (tROI,i), the sum of which determined the total local delay i (tdelay,i = tPA + tROI,i). For each ROI, tdelay,i was estimated from local 18F-FDG kinetics with the delayed input function model (Fig. 1)
Fig. 3
Fig. 3
(a) Representative image of regional gas fraction in the lung, with non-dependent (ND), middle (M), and dependent (D) regions-of-interest shown within the imaged lung field (outlined in green). (b) 18F-FDG activity within the first minute of tracer infusion: 18F-FDG is clearly visible within the right heart (RH, outlined in blue) but not yet distinguishable in the lung. (c,d) The delay required for tracer transport from the right heart to the lungs was evident in the early (<2 min) tracer kinetics, as the activity in the right heart (blue dashed lines) began to rise earlier than the activity in non-dependent (c) or dependent (d) lung regions (green lines). By accounting for tracer transport delays through inclusion of a delay of the right heart plasma function as a model parameter (tdelay), the delayed plasma function in the ROIs (red lines) coincided much more closely with the initial rise in activity of those regions
Fig. 4
Fig. 4
Distributions of ROI-specific delays derived with the delayed input function model. ROI delays (tROI) were computed by subtracting the pulmonary artery delay (tPA) from the total delay estimated from regional 18F-FDG kinetics (tdelay), according to Equation 3. A significant dependence of tROI on gravitational position was found (p<0.001), with the non-dependent (ND) regions showing higher delays than the middle (M) or dependent (D) regions in post-hoc tests. No significant differences were found between the Control, LPS, or Lavage + LPS conditions. *p<0.05, **p<0.01, ***p<0.001
Fig. 5
Fig. 5
(a) Comparison of the Akaike Information Criterion (AIC) for the delayed input function (AICDIF) and right heart input function (AICRHIF) models. Lower AIC values imply better description of the data for the number of model parameters. AICDIF was lower than AICRHIF (i.e., below the identity line) in 53 of 54 studied regions-of-interest. (b) Model improvement with the delayed input function, defined as the difference in AIC between the two models, was significantly correlated with the magnitude of ROI delays (tROI)
Fig. 6
Fig. 6
Comparison of 18F-FDG kinetics parameters estimated with the delayed input function and right heart input function models. Substantial differences between the models were observed for the parameters k1, k2, and FB, which are primarily determined by the early phase of 18F-FDG kinetics. The 18F-FDG net uptake rate Ki, phosphorylation rate k3, and volume of distribution Fe, were quite similar between the models, as data fell close to the line of identity
Fig. 7
Fig. 7
(a) Regional perfusion estimated using the delayed input function model parameters (Q̇DIF) compared with the 13NN-saline reference method (Q̇REF). Data within each animal were mean-normalized, and are shown with distinct symbols. In all three groups, we found strong correlations between the two measurements, with regression lines not significantly different from the line of identity either in terms of slope or intercept. According to both techniques, perfusion was dependent on ROI gravitational position (p<0.001), with non-dependent regions (empty symbols) showing lower perfusion than middle (gray) or dependent regions (black). (b) Mean-normalized fractional blood volume (FB) was also correlated with Q̇REF, though the regression lines differed from the line of identity in terms of both slope and intercept for all three conditions. Of note, the positive intercepts in all groups imply the presence of a residual blood volume when perfusion is equal to zero. (c) Local lung delays (tROI) were inversely associated with Q̇REF in all groups, with regions of higher perfusion showing shorter delays. Curves show regression of tROI onto Q̇REF

References

    1. Akaike H. A new look at the statistical model identification. IEEE Trans Autom Control. 1974;19:716–723.
    1. Bernstine H, Braun M, Yefremov N, Lamash Y, Carmi R, Stern D, Steinmetz A, Sosna J, Groshar D. FDG PET/CT early dynamic blood flow and late standardized uptake value determination in hepatocellular carcinoma. Radiology. 2011;260:503–510. - PubMed
    1. Capen RL, Hanson WL, Latham LP, Dawson CA, Wagner WW., Jr Distribution of pulmonary capillary transit times in recruited networks. J Appl Physiol (1985) 1990;69:473–478. - PubMed
    1. Chen DL, Mintun MA, Schuster DP. Comparison of methods to quantitate 18F-FDG uptake with PET during experimental acute lung injury. J Nucl Med. 2004;45:1583–1590. - PubMed
    1. Chen DL, Schuster DP. Positron emission tomography with [18F]fluorodeoxyglucose to evaluate neutrophil kinetics during acute lung injury. Am J Physiol Lung Cell Mol Physiol. 2004;286:L834–40. - PubMed

Publication types

Substances

LinkOut - more resources