. 2015 Jun;135(6):1115-25.
doi: 10.1542/peds.2015-0434. Epub 2015 May 4.

Annual summary of vital statistics: 2012-2013

Affiliations

Annual summary of vital statistics: 2012-2013

Michelle J K Osterman et al. Pediatrics. 2015 Jun.

Abstract

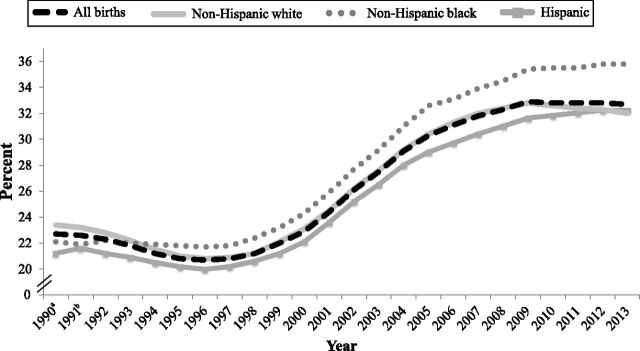
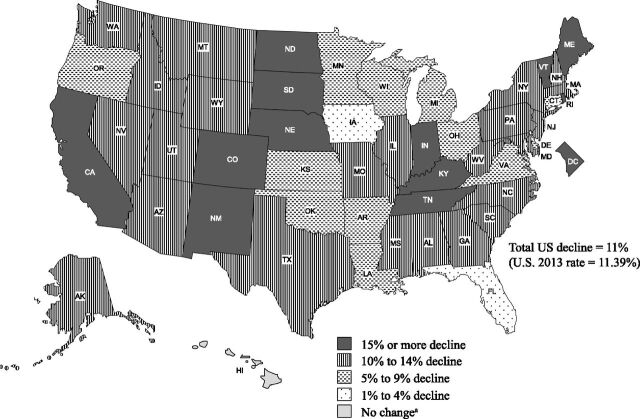
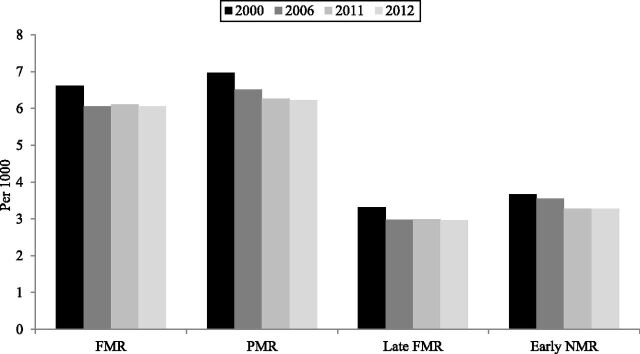
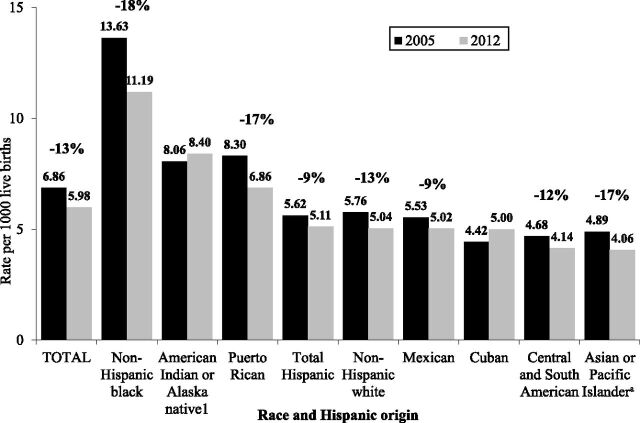
The number of births in the United States declined by 1% between 2012 and 2013, to a total of 3 932 181. The general fertility rate also declined 1% to 62.5 births per 1000 women, the lowest rate ever reported. The total fertility rate was down by 1% in 2013 (to 1857.5 births per 1000 women). The teenage birth rate fell to another historic low in 2013, 26.5 births per 1000 women. Birth rates also declined for women 20 to 29 years, but the rates rose for women 30 to 39 and were unchanged for women 40 to 44. The percentage of all births that were to unmarried women declined slightly to 40.6% in 2013, from 40.7% in 2012. In 2013, the cesarean delivery rate declined to 32.7% from 32.8% for 2012. The preterm birth rate declined for the seventh straight year in 2013 to 11.39%; the low birth weight (LBW) rate was essentially unchanged at 8.02%. The infant mortality rate was 5.96 infant deaths per 1000 live births in 2013, down 13% from 2005 (6.86). The age-adjusted death rate for 2013 was 7.3 deaths per 1000 population, unchanged from 2012. Crude death rates for children aged 1 to 19 years declined to 24.0 per 100 000 population in 2013, from 24.8 in 2012. Unintentional injuries and suicide were, respectively, the first and second leading causes of death in this age group. These 2 causes of death jointly accounted for 45.7% of all deaths to children and adolescents in 2013.


Conflict of interest statement

FINANCIAL DISCLOSURE: The authors have indicated they have no financial relationships relevant to this article to disclose.

Figures

FIGURE 1. Cesarean delivery rates, by race and Hispanic origin: United States, 1990–2013. aExcludes data for New Hampshire and Oklahoma, which did not report data by Hispanic origin. Oklahoma did not report method of delivery. bExcludes data for New Hampshire, which did not report data by Hispanic origin. Source: Centers for Disease Control and Prevention/NCHS, National Vital Statistics System.
FIGURE 1
Cesarean delivery rates, by race and Hispanic origin: United States, 1990–2013. aExcludes data for New Hampshire and Oklahoma, which did not report data by Hispanic origin. Oklahoma did not report method of delivery. bExcludes data for New Hampshire, which did not report data by Hispanic origin. Source: Centers for Disease Control and Prevention/NCHS, National Vital Statistics System.
FIGURE 2. Percent change in preterm birth rates by state: United States, 2006 and 2013. aChange not significant at P = .05. Note: Preterm is <37 completed weeks of gestation. Source: Centers for Disease Control and Prevention/NCHS, National Vital Statistics System.
FIGURE 2
Percent change in preterm birth rates by state: United States, 2006 and 2013. aChange not significant at P = .05. Note: Preterm is <37 completed weeks of gestation. Source: Centers for Disease Control and Prevention/NCHS, National Vital Statistics System.
FIGURE 3. Fetal mortality, perinatal mortality, late-fetal mortality, and early NMRs: 2000, 2006, 2011, and 2012. Note: FMR indicates fetal deaths per 1000 live births plus fetal deaths; early FMR, early-fetal deaths (20–27 weeks) per 1000 live births plus fetal deaths; late FMR, late fetal deaths (≥28 weeks) per 1000 live births plus fetal deaths; PMR, late-fetal deaths and early neonatal (<7 days of age) deaths per 1000 live births plus fetal deaths; early NMR, early-neonatal (<7 days of age) deaths per 1000 live births. Source: Centers for Disease Control and Prevention/NCHS, National Vital Statistics System.
FIGURE 3
Fetal mortality, perinatal mortality, late-fetal mortality, and early NMRs: 2000, 2006, 2011, and 2012. Note: FMR indicates fetal deaths per 1000 live births plus fetal deaths; early FMR, early-fetal deaths (20–27 weeks) per 1000 live births plus fetal deaths; late FMR, late fetal deaths (≥28 weeks) per 1000 live births plus fetal deaths; PMR, late-fetal deaths and early neonatal (<7 days of age) deaths per 1000 live births plus fetal deaths; early NMR, early-neonatal (<7 days of age) deaths per 1000 live births. Source: Centers for Disease Control and Prevention/NCHS, National Vital Statistics System.
FIGURE 4. IMRs by race and Hispanic origin of mother: United States, 2005 and 2012. aIncludes persons of Hispanic and non-Hispanic origin. Note: Percent change indicates statistically significant change between 2005 and 2012. Source: Linked birth/infant death data set, NCHS, Centers for Disease Control and Prevention.
FIGURE 4
IMRs by race and Hispanic origin of mother: United States, 2005 and 2012. aIncludes persons of Hispanic and non-Hispanic origin. Note: Percent change indicates statistically significant change between 2005 and 2012. Source: Linked birth/infant death data set, NCHS, Centers for Disease Control and Prevention.

Similar articles

Cited by

References

    1. Martin JA , Hamilton BE , Osterman MJK , Curtin SC , Matthews TJ . Births: final data for 2013. Natl Vital Stat Rep. 2015;64(1):1–65. Available at: www.cdc.gov/nchs/data/nvsr/nvsr64/nvsr64_01.pdf. Accessed November 10, 2014 - PubMed
    1. Gregory ECW, MacDorman MF, Martin JA. Trends in fetal and perinatal mortality in the United States, 2006-2012. NCHS data brief. 2014;169. Available at: www.cdc.gov/nchs/data/databriefs/db169.pdf. Accessed November 24, 2014 - PubMed
    1. Murphy SL , Xu JQ , Kochanek KD , et al. . Deaths: final data for 2012. Natl Vital Stat Rep. 2015;63(9) - PubMed
    1. Xu JQ , Murphy SL , Kochanek KD , et al. . Deaths: final data for 2013. Natl Vital Stat Rep. 2015;64(2) - PubMed
    1. National Center for Health Statistics. Natality public use file and CD-ROM. Hyattsville, MD: National Center for Health Statistics. Published annually. Available at: www.cdc.gov/nchs/data_access/VitalStatsOnline.htm. Accessed November 10, 2014

LinkOut - more resources