

Modeling malaria genomics reveals transmission decline and rebound in Senegal
- PMID: 25941365
- PMCID: PMC4460456
- DOI: 10.1073/pnas.1505691112
Modeling malaria genomics reveals transmission decline and rebound in Senegal
Abstract
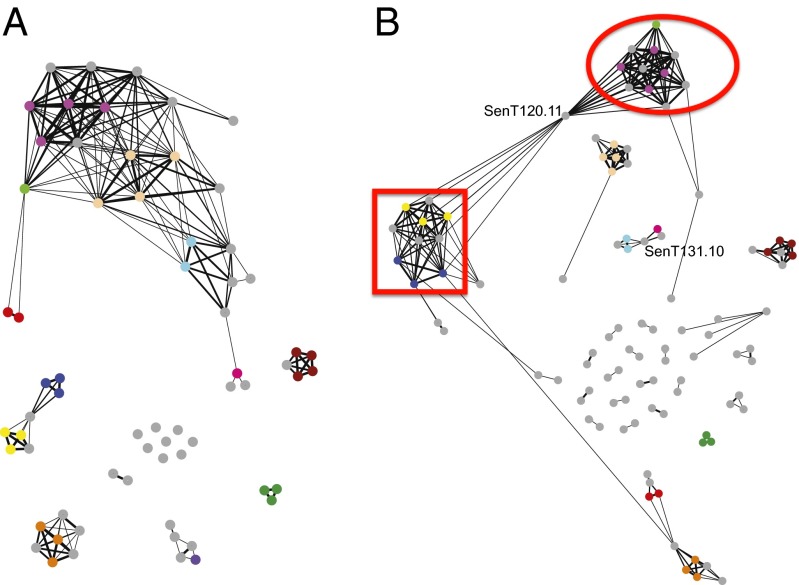
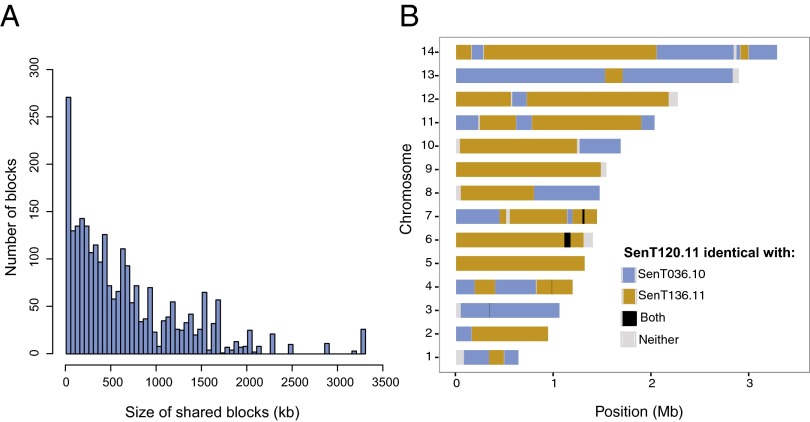
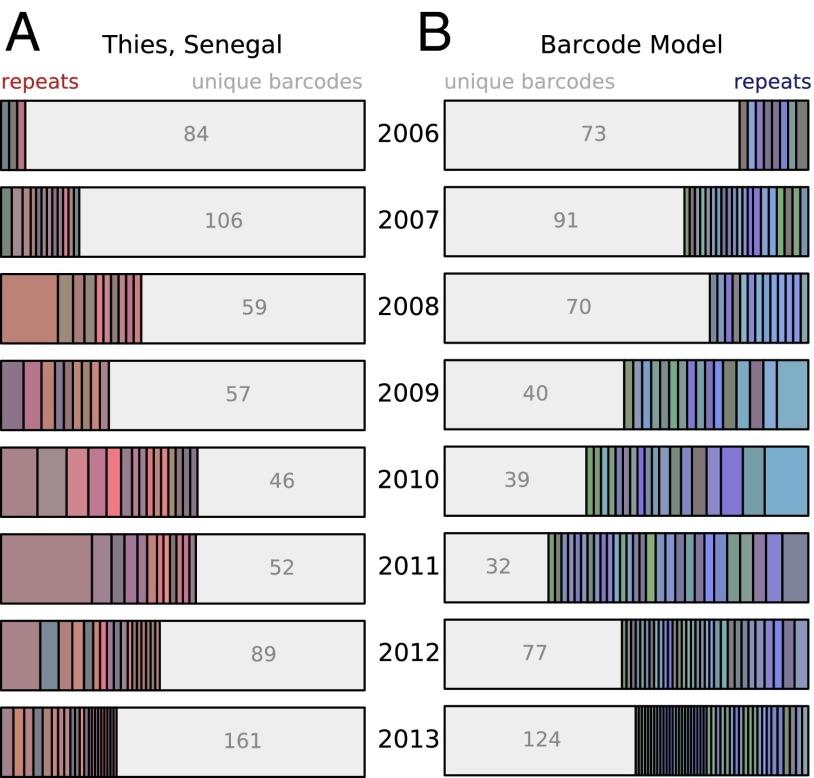
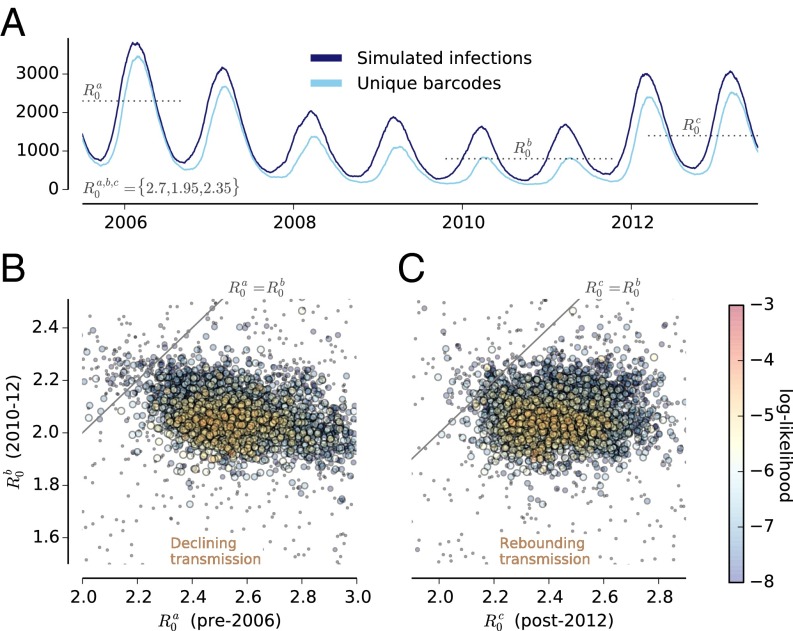
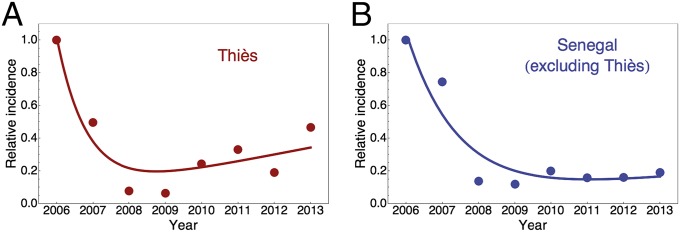
To study the effects of malaria-control interventions on parasite population genomics, we examined a set of 1,007 samples of the malaria parasite Plasmodium falciparum collected in Thiès, Senegal between 2006 and 2013. The parasite samples were genotyped using a molecular barcode of 24 SNPs. About 35% of the samples grouped into subsets with identical barcodes, varying in size by year and sometimes persisting across years. The barcodes also formed networks of related groups. Analysis of 164 completely sequenced parasites revealed extensive sharing of genomic regions. In at least two cases we found first-generation recombinant offspring of parents whose genomes are similar or identical to genomes also present in the sample. An epidemiological model that tracks parasite genotypes can reproduce the observed pattern of barcode subsets. Quantification of likelihoods in the model strongly suggests a reduction of transmission from 2006-2010 with a significant rebound in 2012-2013. The reduced transmission and rebound were confirmed directly by incidence data from Thiès. These findings imply that intensive intervention to control malaria results in rapid and dramatic changes in parasite population genomics. The results also suggest that genomics combined with epidemiological modeling may afford prompt, continuous, and cost-effective tracking of progress toward malaria elimination.
Keywords: epidemiology; genomics; malaria.
Conflict of interest statement
The authors declare no conflict of interest.
Figures
Comment in
-
Malaria genotyping for epidemiologic surveillance.Proc Natl Acad Sci U S A. 2015 Jun 2;112(22):6782-3. doi: 10.1073/pnas.1507727112. Epub 2015 May 27. Proc Natl Acad Sci U S A. 2015. PMID: 26016526 Free PMC article. No abstract available.
References
-
- Mouzin E, Thior PM, Diouf MB, Sambou B. Focus on Senegal Roll Back Malaria: Progress and Impact Series. Vol 4 World Health Organization; Geneva: 2010.
Publication types
MeSH terms
Grants and funding
- AI099105/AI/NIAID NIH HHS/United States
- R01 AI106734/AI/NIAID NIH HHS/United States
- T32 AI049928/AI/NIAID NIH HHS/United States
- U19AI089696/AI/NIAID NIH HHS/United States
- K23 AI072033/AI/NIAID NIH HHS/United States
- R01 AI099105/AI/NIAID NIH HHS/United States
- 5D43TW001503/TW/FIC NIH HHS/United States
- K23AI072033/AI/NIAID NIH HHS/United States
- U54 GM088558/GM/NIGMS NIH HHS/United States
- U19 AI089696/AI/NIAID NIH HHS/United States
- U54GM088558/GM/NIGMS NIH HHS/United States
- AI034969/AI/NIAID NIH HHS/United States
- R01 AI034969/AI/NIAID NIH HHS/United States
- D43 TW001503/TW/FIC NIH HHS/United States
- AI106734/AI/NIAID NIH HHS/United States
LinkOut - more resources
Full Text Sources
Other Literature Sources
Medical
