. 2015 May 19;112(20):E2658-66.
doi: 10.1073/pnas.1424949112. Epub 2015 May 4.

Obstruction of adaptation in diploids by recessive, strongly deleterious alleles

Affiliations

Obstruction of adaptation in diploids by recessive, strongly deleterious alleles

Zoe June Assaf et al. Proc Natl Acad Sci U S A. .

Abstract

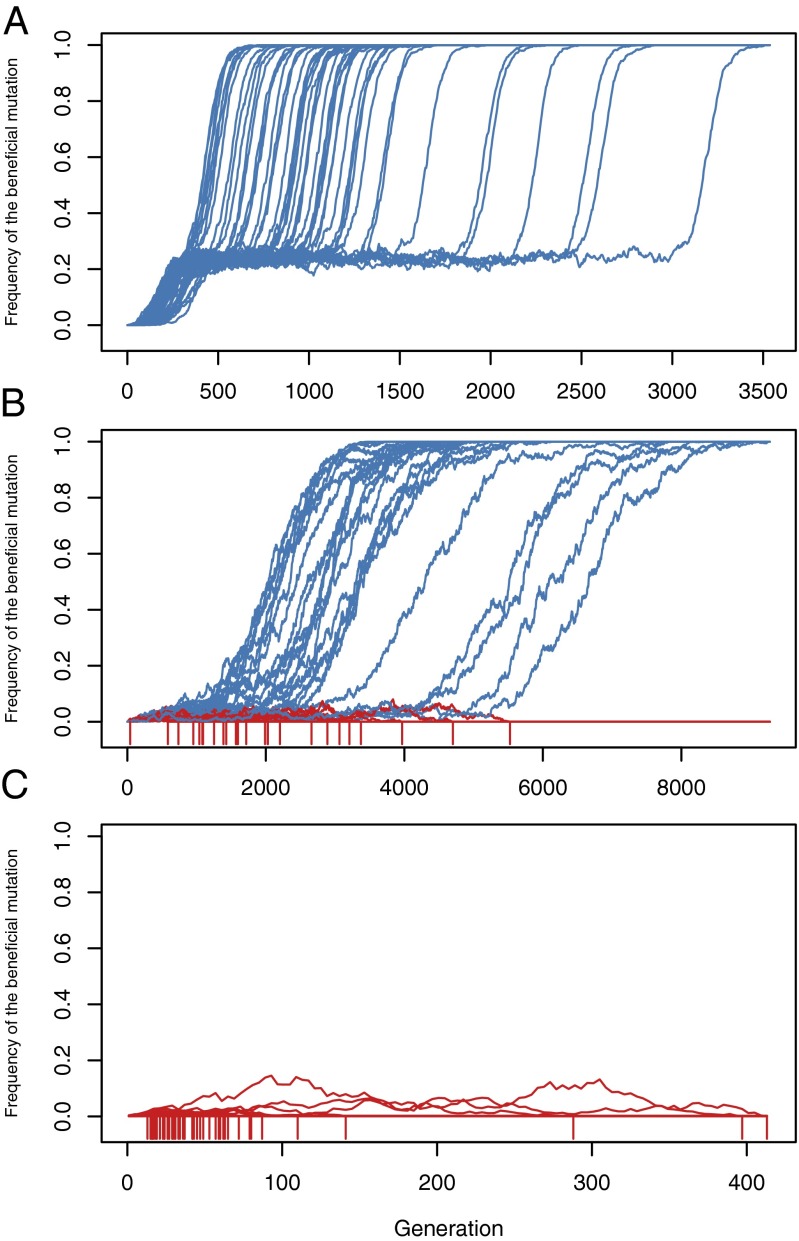
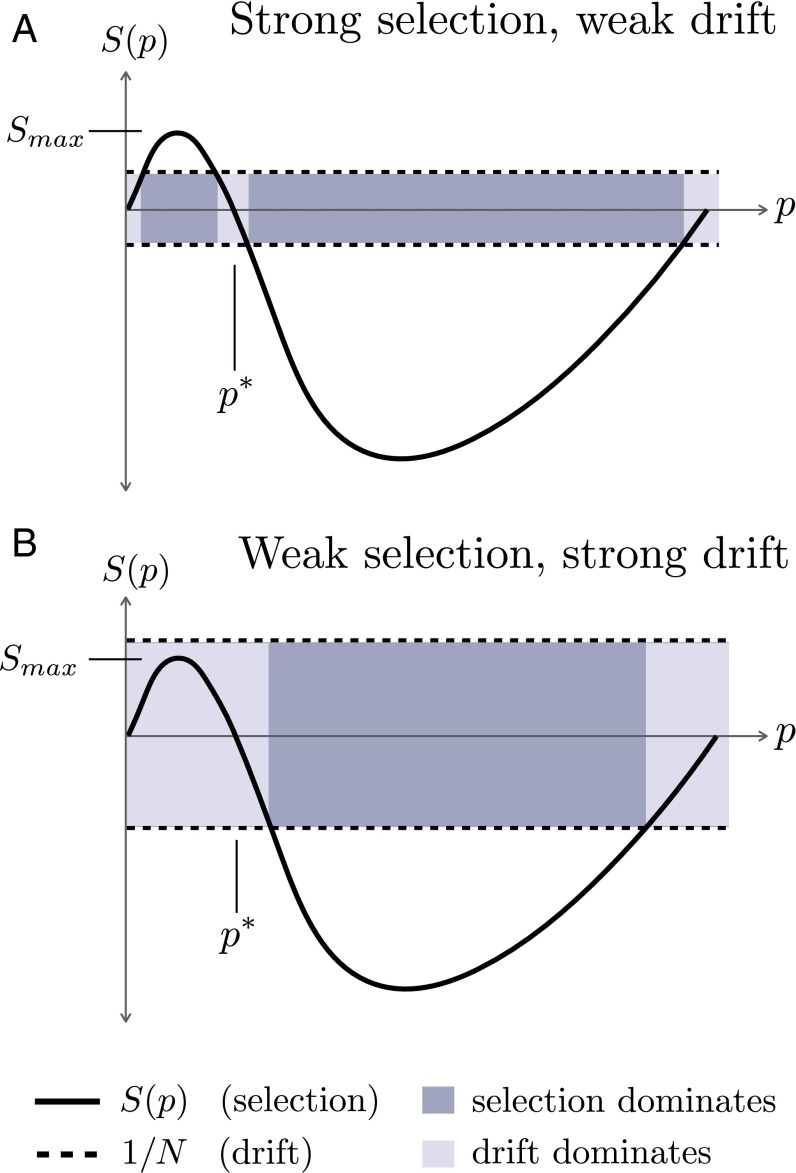
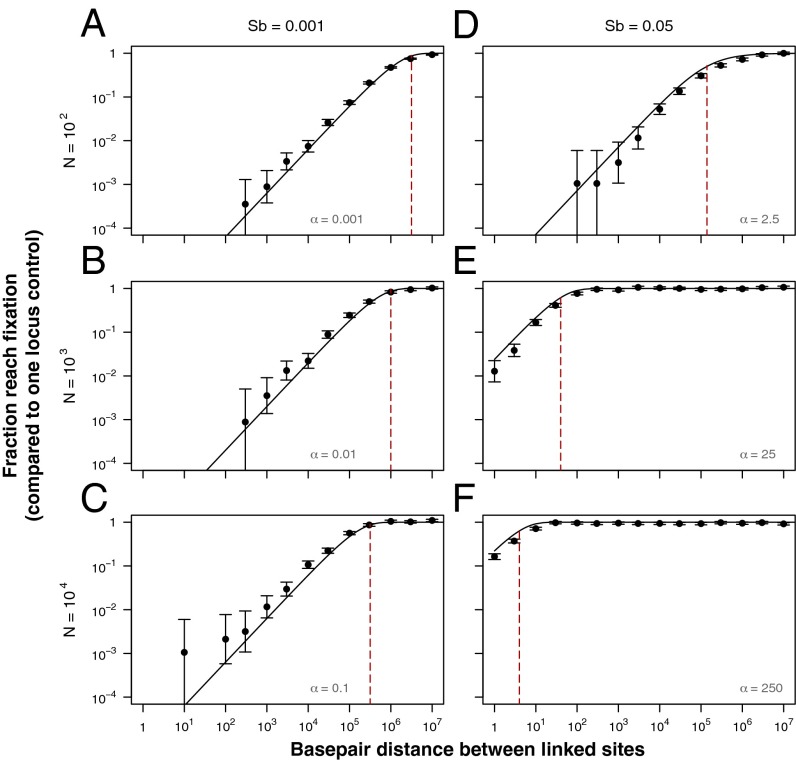
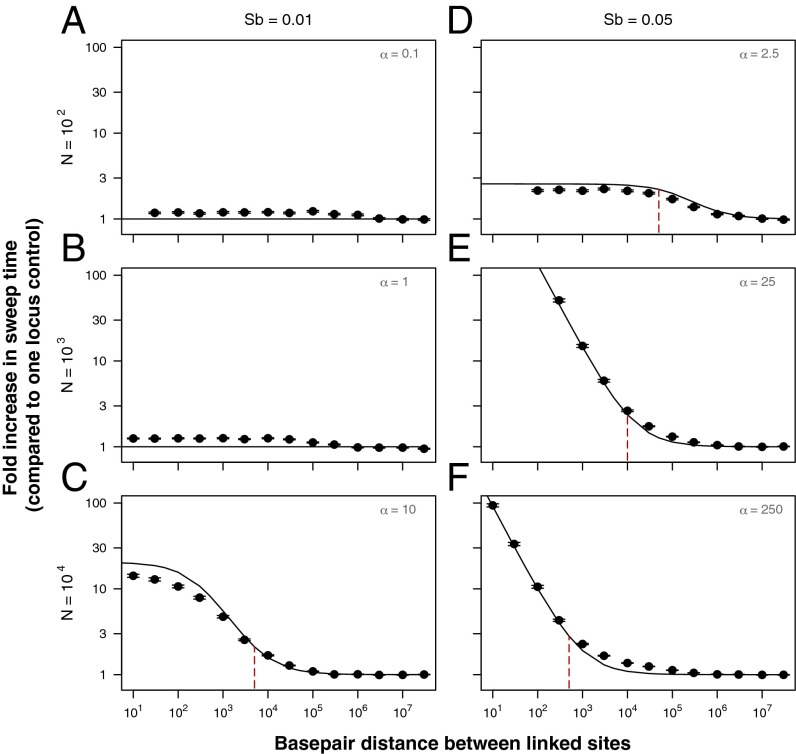
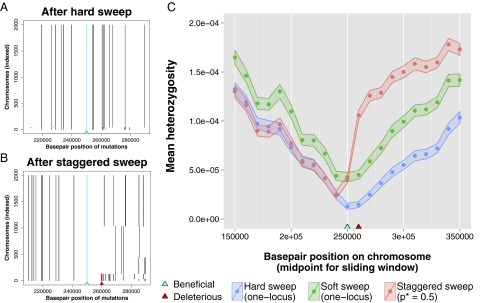
Recessive deleterious mutations are common, causing many genetic disorders in humans and producing inbreeding depression in the majority of sexually reproducing diploids. The abundance of recessive deleterious mutations in natural populations suggests they are likely to be present on a chromosome when a new adaptive mutation occurs, yet the dynamics of recessive deleterious hitchhikers and their impact on adaptation remains poorly understood. Here we model how a recessive deleterious mutation impacts the fate of a genetically linked dominant beneficial mutation. The frequency trajectory of the adaptive mutation in this case is dramatically altered and results in what we have termed a "staggered sweep." It is named for its three-phased trajectory: (i) Initially, the two linked mutations have a selective advantage while rare and will increase in frequency together, then (ii), at higher frequencies, the recessive hitchhiker is exposed to selection and can cause a balanced state via heterozygote advantage (the staggered phase), and (iii) finally, if recombination unlinks the two mutations, then the beneficial mutation can complete the sweep to fixation. Using both analytics and simulations, we show that strongly deleterious recessive mutations can substantially decrease the probability of fixation for nearby beneficial mutations, thus creating zones in the genome where adaptation is suppressed. These mutations can also significantly prolong the number of generations a beneficial mutation takes to sweep to fixation, and cause the genomic signature of selection to resemble that of soft or partial sweeps. We show that recessive deleterious variation could impact adaptation in humans and Drosophila.

Keywords: adaptation; hitchhiking; inbreeding depression; recessive; selective sweep.


Conflict of interest statement

The authors declare no conflict of interest.

Figures

Fig. 1.
Fig. 1.
Frequency trajectories of a beneficial mutation genetically linked to a recessive deleterious hitchhiker. Plotted trajectories are from 50 simulations that reached an equilibrium frequency of p=sb/sd, where blue indicates simulations that fixed the beneficial mutation and red indicates simulations in which it goes extinct (red tick marks below frequency zero mark the generation of extinction). (A) For α1, selection dominates, and the BD haplotype staggers stably at the equilibrium frequency waiting for a recombination event that allows the beneficial mutation to escape on a BO haplotype to fixation. In this regime, loss of the beneficial mutation is very rare, and the staggered sweep can last for a substantial time. (B) For α1, selection and drift are both important, and the BD haplotype staggers at the equilibrium frequency but with strong frequency fluctuations due to drift that can drive the BD haplotype to extinction (but not fixation) before an escape event occurs. (C) For α1, drift dominates, and the BD haplotype never stably staggers; thus frequency changes are dominated by drift. Note that it cannot drift to fixation because of the recessive deleterious mutation (Fig. 2). Unless a recombination event occurs very early, the beneficial mutation will fluctuate to extinction on the BD haplotype.
Fig. 2.
Fig. 2.
A model of drift and balancing selection (without recombination). (A) Schematic of α=NSmax>1 regime, where the maximum positive effect of balancing selection (Smaxsb2/sd) is stronger than the effect of drift (1/N). In this regime, the BD haplotype can balance at an equilibrium frequency and then either escape to fixation via recombination (as in Fig. 1 A and B, blue trajectories) or drift to extinction (as in Fig. 1B, red trajectories). The rate of drifting to extinction from equilibrium depends primarily on αNsb2/sd. (B) Schematic of α=NSmax<1 regime, where the maximum positive effect of balancing selection (Smax) is weaker than the effect of drift (1/N), and thus frequency dynamics of a balanced haplotype are always dominated by drift near (or below) equilibrium frequency. In this regime, the BD haplotype neither establishes nor stably balances, and thus primarily drifts to extinction before an escape event occurs (as in Fig. 1C).
Fig. 3.
Fig. 3.
Analytics predict simulation results for the fraction of staggered sweeps that reach fixation. The y axis is the fraction of simulations in which the beneficial mutation reaches fixation relative to a one-locus control with no hitchhiker, and the x axis is base pair distance between the linked sites. The population size (N) used in each panel is indicated by the figure row headings, and the beneficial mutation effect size (sb) used in each panel is indicated by the figure column headings, such that AC fall into the α < 1 regime, and DF fall into the α > 1 regime. Points represent results of 1,000/sb simulations (where bars indicate 95% binomial proportion confidence interval), solid lines indicate our analytic predictions (AC use Eq. S31 due to α<1, and DF use Eq. 12 due to α>1). Red dashed lines are analytic predictions for the distance ll below which the probability of fixation becomes suppressed (AC use Eq. S37 and DF use Eq. S33). All simulations used sd=0.1. We have translated recombination rate r×l between the sites into base pair distance using a human recombination rate per base pair per generation r=108.
Fig. 4.
Fig. 4.
Analytics predict simulation results for the mean sweep time of staggered sweeps. The y axis is the fold increase in the beneficial mutation’s sweep time relative to a one-locus control with no hitchhiker, and the x axis is the base pair distance between the linked sites. The population size (N) used in each panel is indicated by the figure row headings, and the beneficial mutation effect size (sb) used in each panel is indicated by the figure column headings, such that A and B have α ≤ 1, and CF have α > 1. Points represent results of 500 simulations in which fixation of the beneficial mutation occurred (required to calculate its sweep time), where bars indicate ±SE and solid lines indicate our analytic predictions (A and B have α<1 and thus no increase in sweep time; CF have α>1 and thus use Eq. 13). Red dashed lines are analytic predictions for the distance le at which the mean sweep time becomes extended (Eq. S35 and SI Text, section 3.2). For more discussion of the leveling off of sweep times at low recombination rates in C and D, see SI Text, section 4.5. All simulations used sd=0.1. We have translated recombination rate r×l between the sites into base pair distance using a human recombination rate per base pair per generation r=108.
Fig. 5.
Fig. 5.
Altered signatures of selection in the genome after a staggered sweep. Simulations were performed using SliM (68) to generate and track neutral diversity around the adaptive site, where simulations used sb=0.05 and N = 1,000 diploids. (A) Haplotypes present in a population at the conclusion of single simulation of a hard sweep in which a beneficial mutation on a haplotype containing only neutral mutations was seeded at establishment frequency; note that a single haplotype dominates the population. (B) Haplotypes present in a population at the conclusion of single simulation of a staggered sweep in which a beneficial mutation on a haplotype containing both neutral mutations and a single recessive deleterious mutation (sd=0.05) 10 kb away (where r=108) was seeded at establishment frequency. Note that recombination has unlinked the beneficial and recessive deleterious mutations, such that multiple haplotypes are at high frequency in the population after fixation of the beneficial mutation. (C) Mean heterozygosity across 200 simulations calculated in sliding windows of length 30 kb with step size 10 kb, where the ribbon around data points indicates the SEM. Results are plotted for hard sweep simulations in which a new adaptive mutation occurs on a single haplotype, soft sweep simulations in which a new adaptive mutation occurs on multiple haplotypes (Nub ≈ 1), and staggered sweep simulations in which an adaptive mutation occurs on a single haplotype background containing a recessive deleterious mutation (sd=0.05).

References

    1. Haldane JBS. A mathematical theory of natural and artificial selection, part V: Selection and mutation. Math Proc Cambridge Philos Soc. 1927;23(7):838−844.
    1. Charlesworth B. Adaptive evolution: The struggle for dominance. Curr Biol. 1998;8(14):R502–R504. - PubMed
    1. Fisher RA. The possible modification of the response of the wild type to recurrent mutations. Am Nat. 1928;62(1):115–116.
    1. Wright S. Physiological and evolutionary theories of dominance. Am Nat. 1934;68(714):24–53.
    1. Kacser H, Burns JA. The molecular basis of dominance. Genetics. 1981;97(3-4):639–666. - PMC - PubMed

Publication types

LinkOut - more resources