. 2015 May 5;11(5):e1004838.
doi: 10.1371/journal.ppat.1004838. eCollection 2015 May.

Group Selection and Contribution of Minority Variants during Virus Adaptation Determines Virus Fitness and Phenotype

Affiliations

Group Selection and Contribution of Minority Variants during Virus Adaptation Determines Virus Fitness and Phenotype

Antonio V Bordería et al. PLoS Pathog. .

Abstract

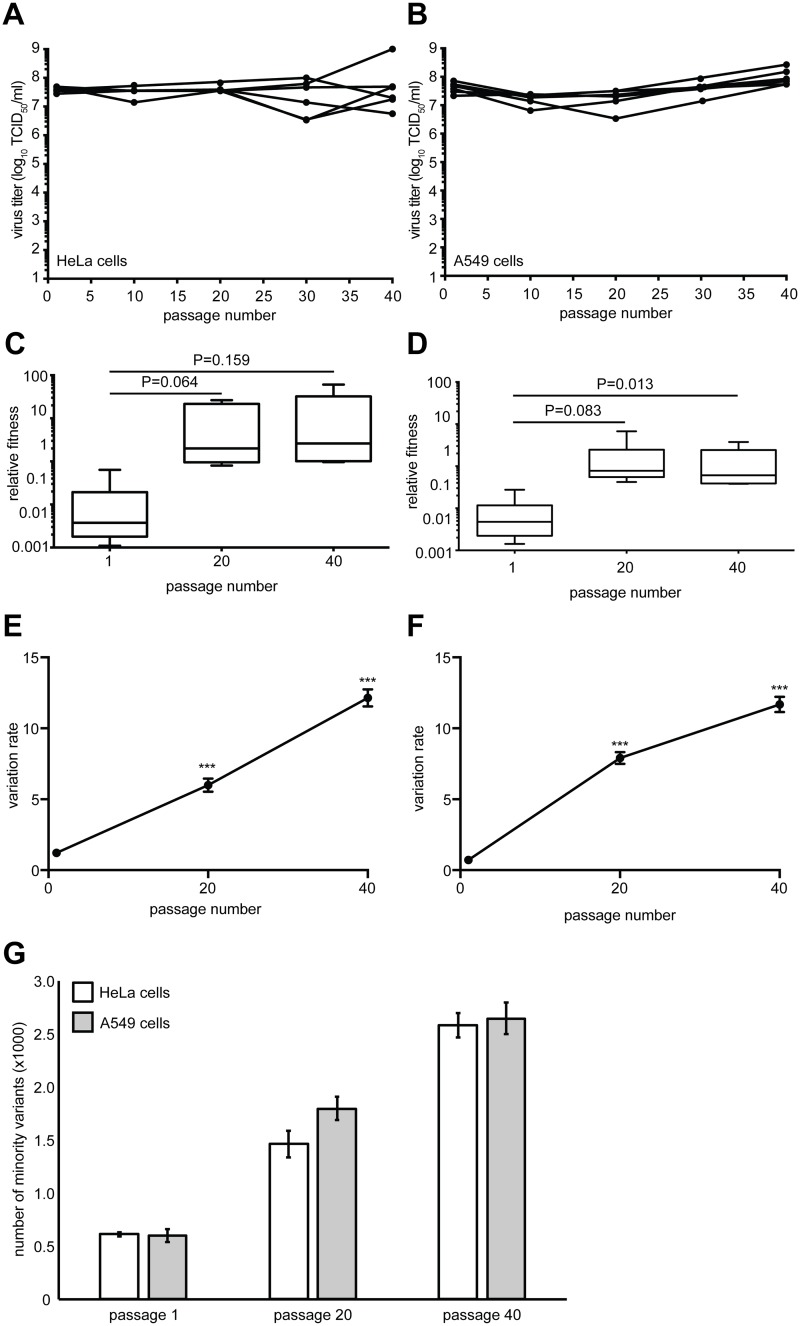
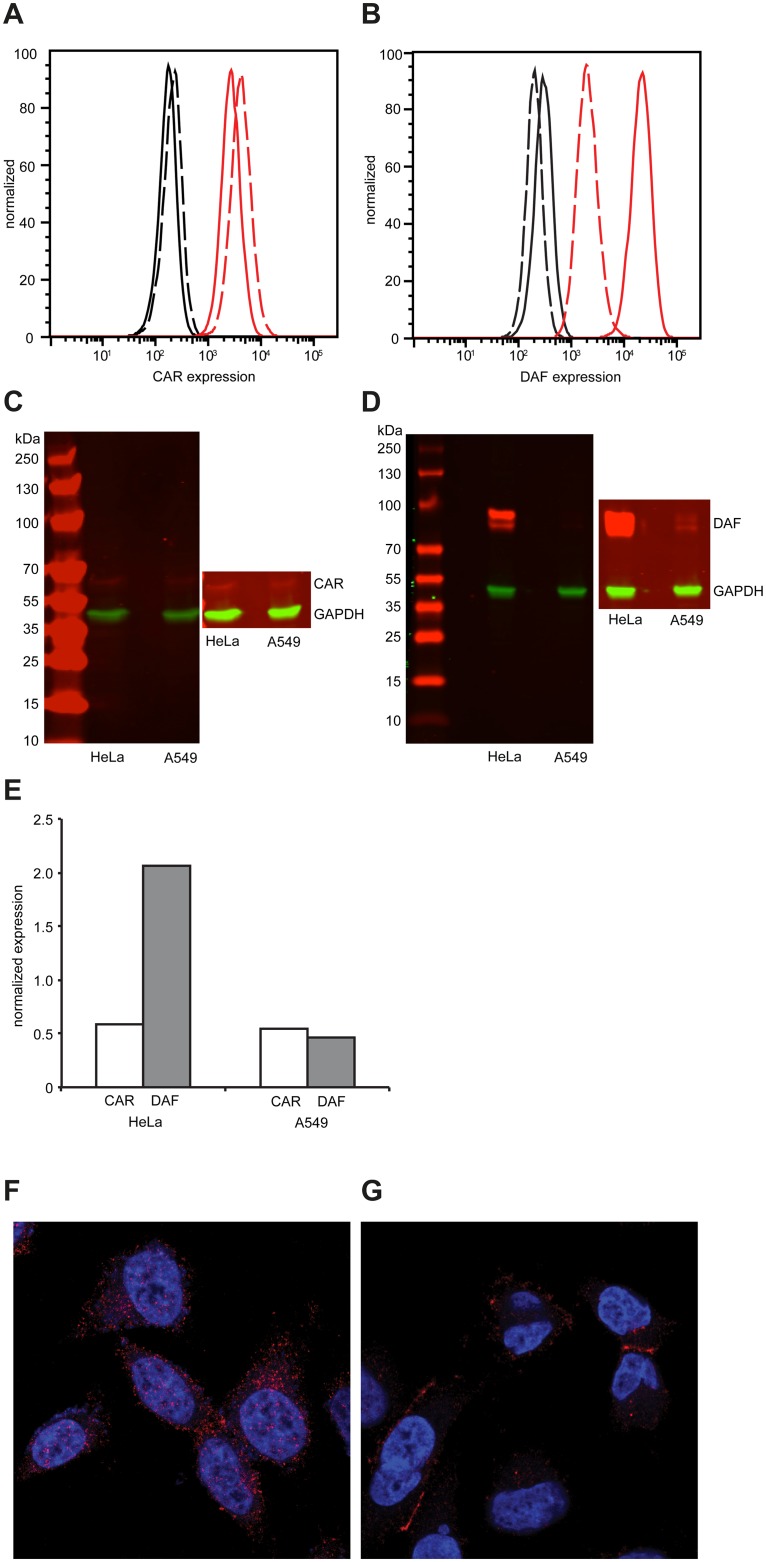
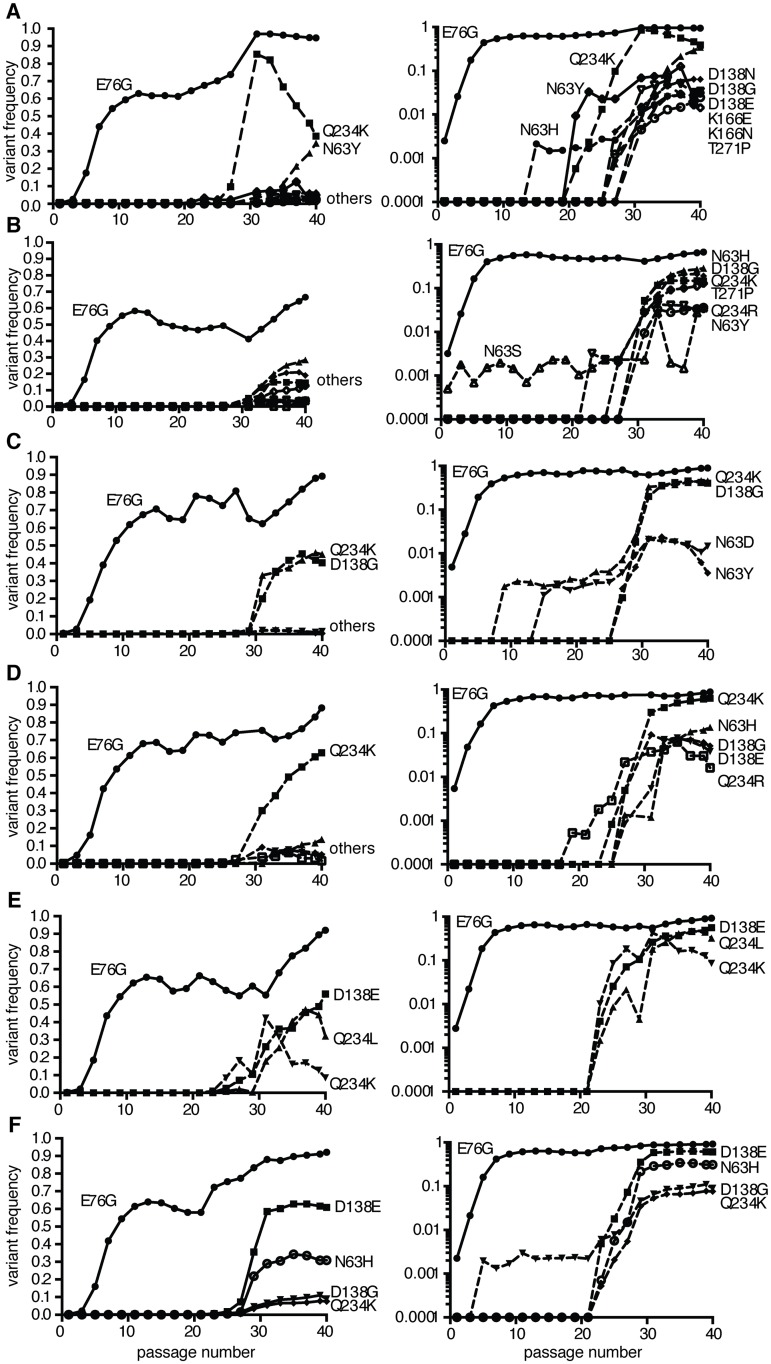
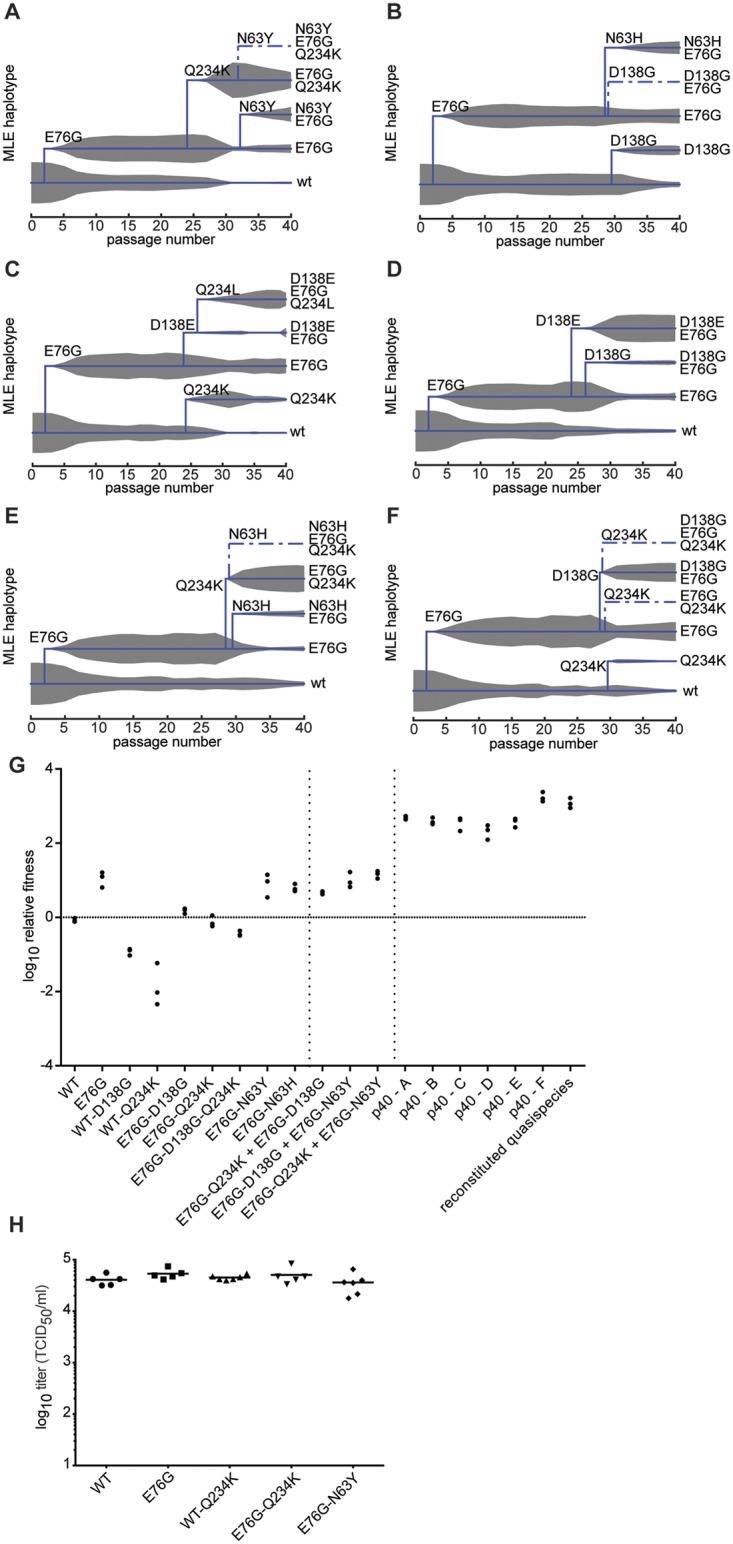
Understanding how a pathogen colonizes and adapts to a new host environment is a primary aim in studying emerging infectious diseases. Adaptive mutations arise among the thousands of variants generated during RNA virus infection, and identifying these variants will shed light onto how changes in tropism and species jumps can occur. Here, we adapted Coxsackie virus B3 to a highly permissive and less permissive environment. Using deep sequencing and bioinformatics, we identified a multi-step adaptive process to adaptation involving residues in the receptor footprints that correlated with receptor availability and with increase in virus fitness in an environment-specific manner. We show that adaptation occurs by selection of a dominant mutation followed by group selection of minority variants that together, confer the fitness increase observed in the population, rather than selection of a single dominant genotype.


Conflict of interest statement

The authors have declared that no competing interests exist.

Figures

Fig 1
Fig 1. Virus fitness and genetic diversity increases during serial passage in both HeLa and A549 cells.
HeLa (A) or A549 (B) cells were infected with CVB3 for 40 serial passages (x-axis) and virus progeny titers (y-axis) were determined for each of six replicate series. The relative fitness of each population from the HeLa (C) and A549 (D) series was compared to a non-passaged neutral competitor. Box plots show mean values and S.E.M., bars indicate minimum and maximum values, p values are indicated, student's paired t test, n = 6. The genetic diversity of each replicate was determined for passage 1, 20 and 40 populations in HeLa (E) and A549 (F) cells by calculating the variation rates at every nucleotide position. The mean variation rates ± S.E.M. are shown. ***p<0.0001, Mann Whitney test, n = 6. (G) The total number of minority variants in passage 1, 20 and 40 HeLa and A549 populations found within the P1 structural protein-coding region. Mean ± S.E.M. are shown. Differences between passage numbers are all significant, p<0.0001; no significant differences between cell type at each passage number, student's paired t test, n = 12.
Fig 2
Fig 2. Differential expression of CAR and DAF in HeLa and A549 cells.
(A-B) Expression of CAR (A) and DAF (B) by flow cytometry in HeLa cells (solid line) or A549 cells (dashed line). Fluorescence of cells in absence of antibody (black) or in presence of CAR- or DAF-specific antibody (red) is shown. Figures are representative of three independent experiments. (C-D) Expression of CAR (C) and DAF (D) by Western blot analysis of HeLa or A549 cell extracts, revealed by CAR-, DAF- and GAPDH-specific antibodies. Molecular weight markers are indicated on the left, super-exposed section of each figure is included to reveal the presence of CAR and the two isoforms of DAF in each sample. Figures are representative of two independent experiments. (E) The relative expression of CAR and DAF with respect to GAPDH was quantified by imaging quantification using ImageJ. Localization of CAR, in red, in HeLa (F) or A549 (G) by confocal microsocopy. Nuclear (blue) staining was done with DAPI.
Fig 3
Fig 3. Population sequencing reveals multi-step adaptation of residues in the DAF-specific footprint during passage in A549 cells.
(A-F) The virus populations were purified and deep sequenced for each replicate every two passages (p1, 3, 5, 7, etc...) across the P1 region coding for the four capsid proteins. The variant frequencies were determined by the ViVAN pipeline and all statistically significant mutations that showed a trend of increasing frequency were plotted in linear scale (left panels) and log scale (right panels). Each set of linear and log graphs represents the same data from one replicate, all six replicate passage series presented in this work are shown.
Fig 4
Fig 4. Mutation E76G confers fitness advantage in A549 cells.
(A) Increasing relative fitness (y-axis) of replicates a-f, over the initial stage of passage series (histograms indicate values for passage 5, 7, 9, 11), mean values with SEM, n = 3. (B) Relative fitness of the CVB3-parental or E76G mutant generated from an infectious cDNA. The relative fitness (y-axis) is the ratio of the viral RNA quantification at 24h and 0h, mean values with SEM, n = 3. (C) The surface rendered map of three CVB3 protomers shown at the icosahedral three-fold axis of the virus (grey). Three symmetry related bound molecules of DAF (blue) are shown with a transparent surface rendering to allow visualization of the location of VP3 76 (red) on the virus surface directly below the DAF. (D) Binding to DAF was measured by biolayer interferometry by dipping a DAF loaded sensor into aliquots of CVB3-parental (black) or CVB3-E76G (red).
Fig 5
Fig 5. Maximum likelihood estimates of haplotypes present within the passaged virus populations and contribution of minority variants to population fitness.
MLE was performed using the frequency values of each mutation at each passage in the deep sequence data for replicates a-f (A-F). The trees indicate the presence of wildtype genotype (lowest line on tree) along with the predicted haplotypes as they emerge during the passage series (x-axis). Solid lines indicate haplotypes with highest MLE scores, dashed lines indicate alternative haplotypes that could exist, with lower scores. The thickness of grey area indicates the expected frequency of each haplotype in the population, according to deep sequence data. (G) Relative fitness of the wildtype (WT), single, double and triple variants, followed by combinations of single variants, followed by passaged population samples (p40 replicates A-F) and reconstituted quasipecies. Reconstituted quasispecies is composed of 50:30:10:10 of E76G, E76G+N63Y, E76G+D138G, and E76G+Q234K. Vertical dashed lines are placed to separate the aforementioned groups to facilitate the reader. Horizontal line is placed to facilitate reading of neutral fitness (value 0). The relative fitness (y-axis) is the ratio of the viral RNA quantification at 24h and 0h, mean values with SEM, n = 3. (H) A549 cells were transfected with in vitro transcribed infectious RNA corresponding to dawildtype (WT), single and double variants. At 8 hours post-transfection, the progeny virus was quantified by TCID50 assay. No significant differences were observed between WT and variants (p = 0.203, 0.400, 0.365, 0.504, respectively, n = 5–6, two-tailed Mann Whitney test).
Fig 6
Fig 6. Schematic of CVB3 adaptation to differently permissive environments.
In the permissive HeLa cell type, where the both CAR and DAF are highly and ubiquitously expressed, CVB3 accumulates CAR- and CAR/DAF-specific minority variants. In the less permissive A549 cells, where CAR is sequestered at cell-cell junctions and DAF is poorly expressed at the surface, CVB3 first fixates the E76G DAF-specific mutation, with the strongest single contribution to fitness, and in later stages, group selection of other DAF-footprint minority variants occurs.

References

    1. Domingo E, Sabo D, Taniguchi T, Weissmann C (1978) Nucleotide sequence heterogeneity of an RNA phage population. Cell 13: 735–744. - PubMed
    1. Burch CL, Chao L (2000) Evolvability of an RNA virus is determined by its mutational neighbourhood. Nature 406: 625–628. - PubMed
    1. Bedhomme S, Lafforgue G, Elena SF (2012) Multihost experimental evolution of a plant RNA virus reveals local adaptation and host-specific mutations. Mol Biol Evol. 2012 May;29(5):1481–92. 10.1093/molbev/msr314 - DOI - PubMed
    1. Hoelzer K, Murcia PR, Baillie GJ, Wood JLN, Metzger SM, et al. (2010) Intrahost evolutionary dynamics of canine influenza virus in naive and partially immune dogs. J Virol 84: 5329–5335. 10.1128/JVI.02469-09 - DOI - PMC - PubMed
    1. Vignuzzi M, Andino R (2012) Closing the gap: the challenges in converging theoretical, computational, experimental and real-life studies in virus evolution. Current Opinion in Virology 2: 515–518. 10.1016/j.coviro.2012.09.008 - DOI - PMC - PubMed

Publication types

LinkOut - more resources