. 2015 May 4;33(3):314-27.
doi: 10.1016/j.devcel.2015.03.020.

DNA Sequence-Specific Binding of CENP-B Enhances the Fidelity of Human Centromere Function

Affiliations

DNA Sequence-Specific Binding of CENP-B Enhances the Fidelity of Human Centromere Function

Daniele Fachinetti et al. Dev Cell. .

Abstract

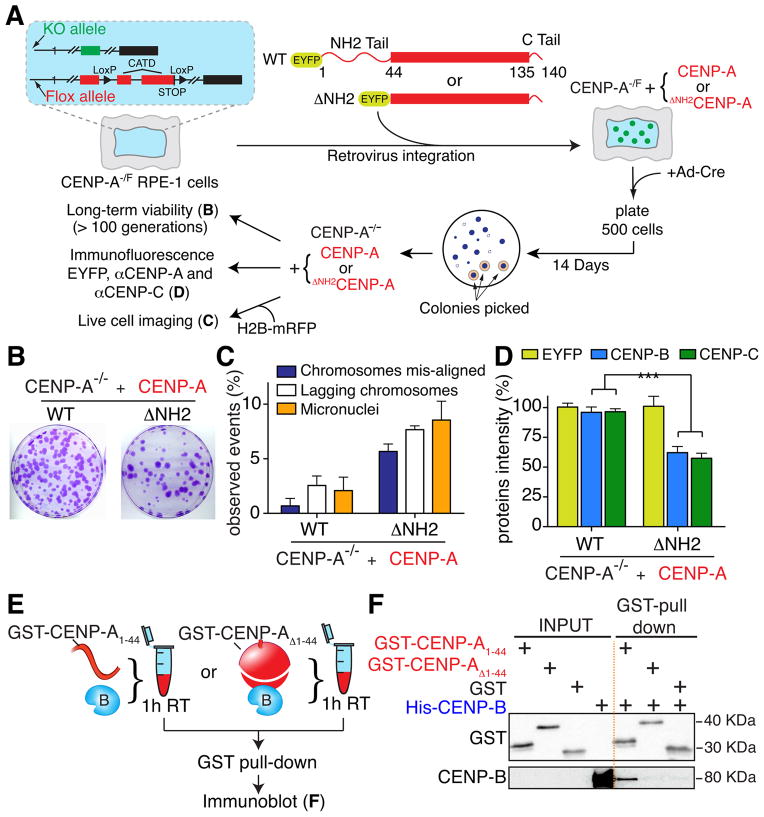
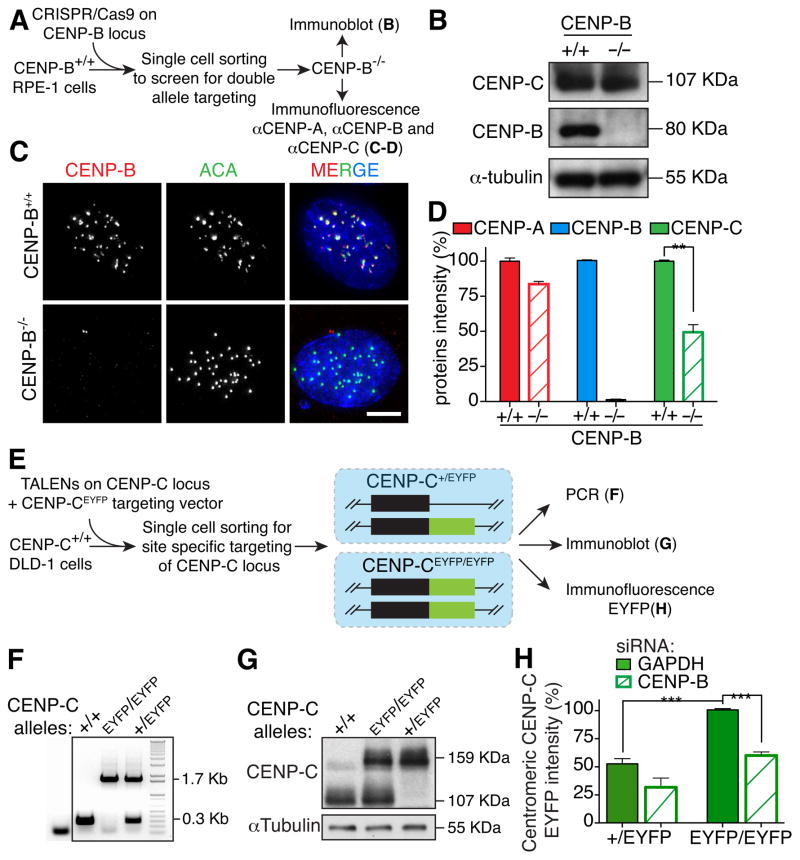
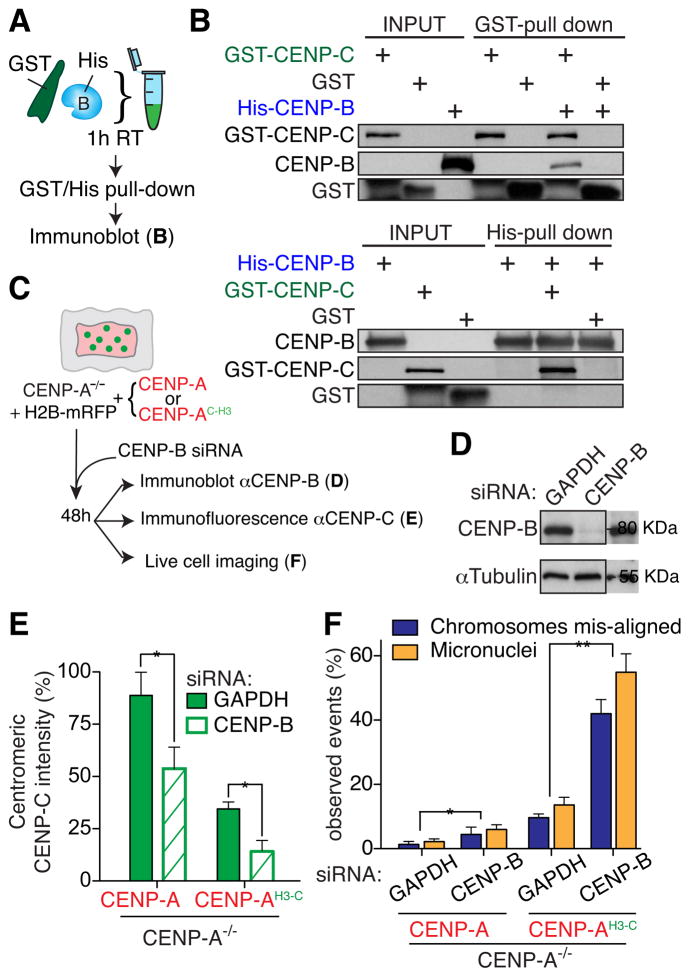
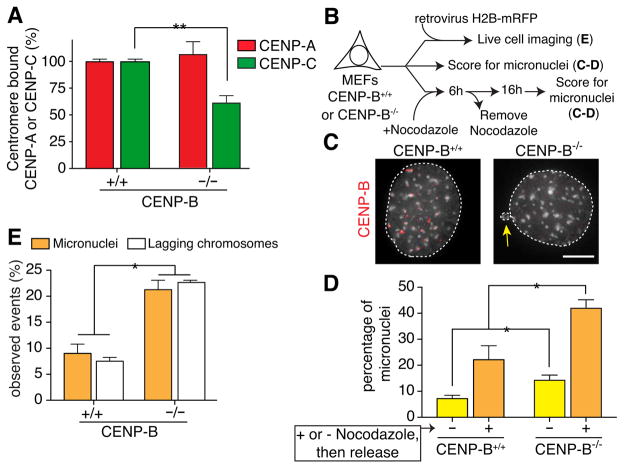
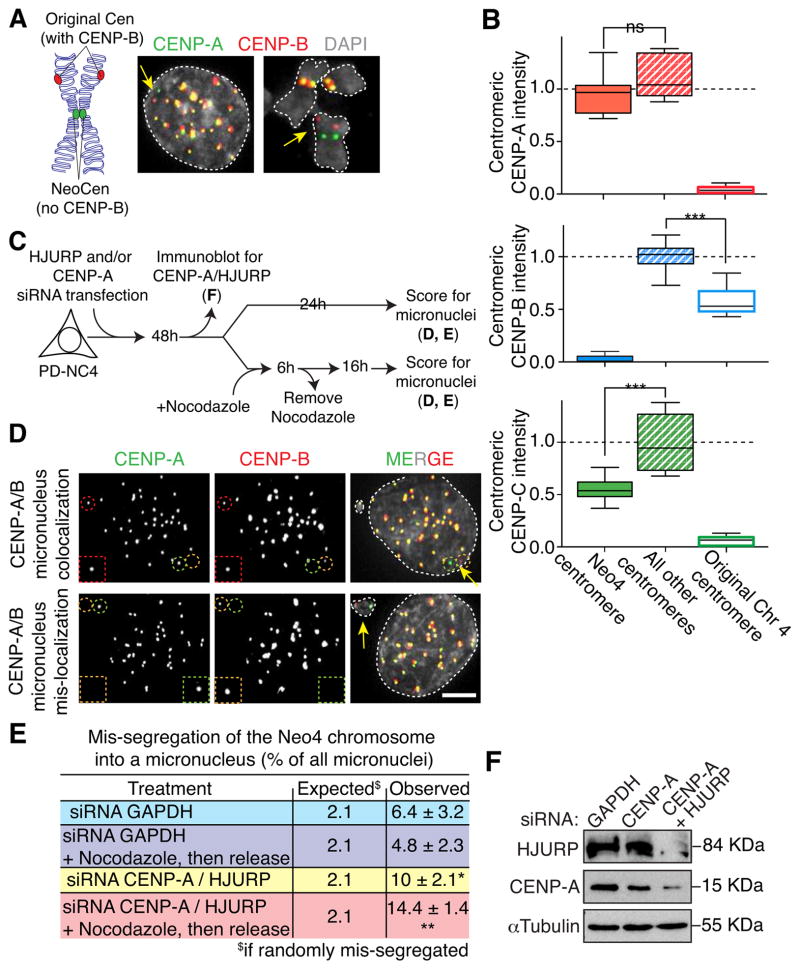
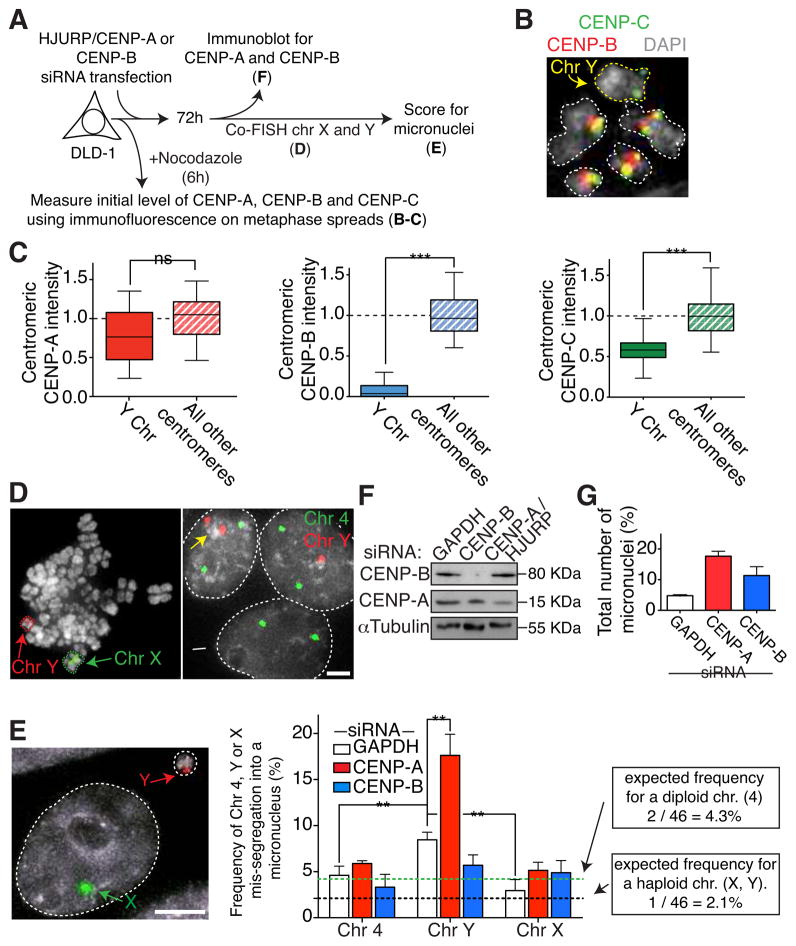
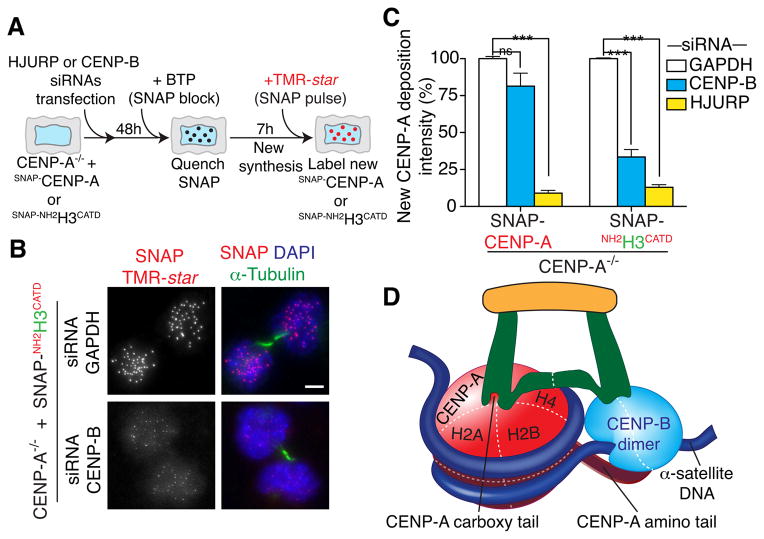
Human centromeres are specified by a stably inherited epigenetic mark that maintains centromere position and function through a two-step mechanism relying on self-templating centromeric chromatin assembled with the histone H3 variant CENP-A, followed by CENP-A-dependent nucleation of kinetochore assembly. Nevertheless, natural human centromeres are positioned within specific megabase chromosomal regions containing α-satellite DNA repeats, which contain binding sites for the DNA sequence-specific binding protein CENP-B. We now demonstrate that CENP-B directly binds both CENP-A's amino-terminal tail and CENP-C, a key nucleator of kinetochore assembly. DNA sequence-dependent binding of CENP-B within α-satellite repeats is required to stabilize optimal centromeric levels of CENP-C. Chromosomes bearing centromeres without bound CENP-B, including the human Y chromosome, are shown to mis-segregate in cells at rates several-fold higher than chromosomes with CENP-B-containing centromeres. These data demonstrate a DNA sequence-specific enhancement by CENP-B of the fidelity of epigenetically defined human centromere function.


Conflict of interest statement

The authors declare no conflict of interest.

Figures

Figure 1
Figure 1. CENP-A amino tail interacts with CENP-B
(A) Schematic representing the different CENP-A rescue constructs amino terminally tagged with EYFP (enhanced yellow fluorescent protein), the CENP-A−/F cell line and the experiments described in B–D. (B) Images of representative crystal violet–stained colonies from the colony formation assay in A. (C) Frequency of mitotic errors in the indicated cell lines. Bars represent the mean of > 50 cells per condition. Error bars represent the SEM of three independent experiments. (D) Bar graphs showing centromere intensities of EYFP-rescue constructs, CENP-B and CENP-C for the indicated cell lines. Values represent the mean of six independent experiments (> 30 cells per experiment, average of 30 centromeres for cell). Error bars represent the SEM (standard error of the mean). Unpaired t test: *** p < 0.0001. (E) Schematic of the experiment performed in F. (F) GST pull-down and subsequent immunoblot for GST-tagged CENP-A co-incubated with His-tagged CENP-B. See also Figure S1.
Figure 2
Figure 2. CENP-B is required for full CENP-C maintenance at centromeres
(A) Schematic of the experiments described in B–D with the use of CRISPR/Cas9-mediated gene deletion (B) Immunoblot for accumulated CENP-B and CENP-C after identification of cells with both CENP-B alleles disrupted by action of the CRISPR/Cas9. α-tubulin was used as a loading control. (C) Representative immunofluorescence images of centromere-bound CENP-B following CRISPR-mediated disruption of both CENP-B alleles in RPE1 cells. ACA was used to mark centromere positions. Scale bar = 5 μm. (D) Bar graphs of centromere intensities for CENP-A (red), CENP-B (blue) and CENP-C (green) in the indicated cell lines quantified with specific antibodies as described in A. Bars represent the mean of three independent experiments (> 30 cells per experiment). Error bars represent the SEM. Unpaired t test: ** p < 0.006. (E) Schematic of the experiments described in F–H with the use of TALENs-mediated gene targeting. (F) CENP-C genotypes validated in the indicated cell lines using PCR to distinguish normal (+/+), double tagged (EYFP/EYFP), and single tagged (+/EYFP). (G) Immunoblot for CENP-C to distinguish non-tagged, single or double allele tagged CENP-C with EYFP. (H) Bar graphs represent CENP-C-EYFP centromeres intensity in the indicated cell lines measured by live cell imaging with or without siRNA treatment of CENP-B. Bars represent the mean of three independent experiments (> 30 cells per experiment, average of 30 centromeres for cell). Error bars represent the SEM. Unpaired t test: *** p < 0.0001. See also Figure S2.
Figure 3
Figure 3. CENP-B supports faithful chromosome segregation via direct CENP-C binding
(A) Schematic of a GST affinity pull-down assay for testing CENP-B binding to GST-tagged CENP-C. (B) GST (top) or His (bottom)-pull-down using the assay detailed in A. (C) Schematic of the experiments described in D–F. (D) Immunoblot of cell extracts to measure total CENP-B level 48 hours after siRNA treatment. α-tubulin was used as a loading control. (E) Bar graphs of centromere intensities for CENP-C in the indicated cell lines. Bars represent the mean of three independent experiments (> 30 cells per experiment). Error bars represent the SEM (standard error of the mean). Unpaired t test: * p < 0.04 (F) Bar graphs of frequency of micronuclei formation and mis-aligned mitotic chromosomes identified with live cell imaging. Bars represent the mean of > 50 cells per condition. Error bars represent the SEM of three independent experiments. Unpaired t test: * p < 0.04, ** p < 0.006. See also Figure S3.
Figure 4
Figure 4. CENP-B is required for faithful chromosome segregation in mouse cells by supporting CENP-C association with centromeres
(A) Quantifications of CENP-A and CENP-C protein levels at centromeres in MEFs with or without CENP-B. Bars represent the mean of three independent experiments (> 30 cells per experiment). Error bars represent the SEM (standard error of the mean). Unpaired t test: ** p < 0.0016. (B) Schematic of the experimental design to test for frequency of micronuclei formation in CENP-B+/+ or CENP-B−/− MEFs before and after recovery from nocodazole-induced mitotic arrest or by live cell imaging. (C) CENP-B deletion increases chances of chromosome mis-segregation leading to micronuclei formation. Representative images of nuclei in CENP-B-containing and CENP-B-depleted MEFs quantified in D. Scale bar = 5 μm. An arrow marks a micronucleus in the CENP-B−/− cell. (D) Quantification of micronuclei frequency in CENP-B+/+ and CENP-B−/− MEFs measured as in B. Bars represent the mean of > 100 cells per condition. Error bars represent the SEM of three independent experiments. Unpaired t test: * p < 0.04. (E) Bar graphs quantifying lagging chromosomes in mitosis or micronuclei in interphase in the indicated cell lines. Bars represent the mean of > 50 cells per condition scored by live cell imaging. Error bars represent the SEM of three independent experiments. Unpaired t test: * p < 0.04.
Figure 5
Figure 5. CENP-B is required for faithful chromosome segregation of the neocentromere chromosome
(A) (Left) Schematic of the neocentromere-containing Neo4 chromosome from PD-NC4 cells. (Right) Representative immunofluorescence images of the neocentromere chromosome in interphase or mitosis (yellow arrows). (B) Box & whisker graphs of CENP-A, CENP-B or CENP-C intensities at the neocentromere (NeoCen), other chromosomes (All other Cens) and the original chromosome 4 measured on metaphase spreads (see Experimental Procedures for details). Error bars represent the SEM. Bar in the box represents the median; the whiskers represent cells distribution. Unpaired t test: *** p < 0.0001. (C) Schematic of the experimental design for testing frequency of micronuclei formation after siRNA treatment to reduce CENP-B or HJURP in PD-NC4 cells with the Neo4 neocentromere, followed by nocodazole-induced mitotic arrest, and subsequent recovery. (D) Chromosome missegregation rates of the Neo4 chromosome or other chromosomes, determined by immunofluorescence. Representative immunofluorescence images of centromere-bound CENP-A and CENP-B after siRNA treatment against GAPDH. Yellow arrows, green and orange circles/squares indicate the neocentromere chromosome, red circles/square a normal chromosome encapsulated in micronuclei. Scale bar = 5 μm. (E) Quantitation of expected and experimentally determined mis-segregation rates from D for the Neo4 chromosome. The observed mis-segregation rate is the frequency with which the Neo4 was found inside micronuclei relative to the total number of micronuclei. The frequency of micronuclei formation was determined by immunofluorescence after the indicated siRNA treatment and, when indicated, following recovery from nocodazole-induced mitotic arrest. Unpaired t test: * p < 0.04, ** p < 0.006. (F) Immunoblot of PD-NC4 cell extracts to measure total CENP-A and HJURP levels after siRNA treatment. α-tubulin was used as a loading control.
Figure 6
Figure 6. The CENP-B-free alphoid DNA-containing Y chromosome has reduced level of CENP-C and increased rate of chromosome mis-segregation
(A) Schematic of the experiments shown in B–F. (B) Representative image of Y chromosome in mitosis (yellow arrow) stained with CENP-C (green) and CENP-B (red) antibodies. (C) Box & whisker plots of CENP-A, CENP-B or CENP-C intensities at the centromere of the Y chromosome compared to all other centromeres measured on metaphase spreads (see Experimental Procedures for details). Error bars represent the SEM. Bar in the box represents the median; the whiskers represent points distribution. Unpaired t test: *** p < 0.0001. (D) (left) Representative immunofluorescence image of a FISH experiment on a metaphase spread using centromeric probes for the Y (red) and X (green) chromosomes. (Right) Representative immunofluorescence image of a FISH experiment on interphase cells using centromeric probes for the Y chromosome (red) or chromosome 4 (green). Yellow arrow indicates a nucleus in a cell that has undergone Y chromosome missegregation so as to accumulate two Y chromosomes. White arrow indicates a nucleus in which missegregation has led to loss of the Y chromosome. (E) Chromosome missegregation rates of chromosomes 4, Y and X determined by FISH. (Left) Representative immunofluorescence image of a micronucleus-containing cell after siRNA treatment to lower CENP-A levels. Scale bar = 5 μm. (Right) Bars represent the frequency of micronuclei formation experimentally determined for chromosome 4, Y and X after the indicated siRNA treatment. The observed mis-segregation rate is the frequency with which the chromosome 4, Y or X chromosomes, respectively, were found inside micronuclei relative to the total number of micronuclei. Unpaired t test: ** p < 0.004 (F) Immunoblot of DLD-1 cell extracts to measure total CENP-A and CENP-B levels after siRNA treatment. α-tubulin was used as a loading control. (G) Bars represent the total number of micronuclei after the indicated siRNA treatment. Error bars represent the SEM of three independent experiments.
Figure 7
Figure 7. CENP-B supports centromeric chromatin replication and function
(A) Schematic of SNAP-tagging experiment to measure new CENP-A deposition at centromeres after siRNA-mediated reduction of CENP-B or HJURP. (B) Representative immunofluorescence images show localization and intensity of SNAP-NH2H3CATD after siRNA of GAPDH or CENP-B. α-tubulin staining was used to identify telophase/early G1 cells. Scale bar = 5 μm. (C) Quantitation of level of centromeric CENP-A deposition after depletion of CENP-B or HJURP. Bars represent the mean of four independent experiments (> 30 cells per experiment). Error bars represent the SEM (standard error of the mean). Unpaired t test: *** p < 0.0001. (D) Model of CENP-B enhanced centromere function through its interaction with CENP-C. Centromere function is supported by a dual mechanism for CENP-C recruitment and subsequent CENP-C-dependent nucleation of kinetochore assembly, mediated both by CENP-A and by CENP-B. See also Figure S4.

References

    1. Amor DJ, Bentley K, Ryan J, Perry J, Slater H, Choo KHA. Human centromere repositioning “in progress”. PNAS. 2004:6542–7. - PMC - PubMed
    1. Barnhart MC, Kuich PHJL, Stellfox ME, Ward JA, Bassett EA, Black BE, Foltz DR. HJURP is a CENP-A chromatin assembly factor sufficient to form a functional de novo kinetochore. The Journal of Cell Biology. 2011;194:229–243. - PMC - PubMed
    1. Bassett EA, Wood S, Salimian KJ, Ajith S, Foltz DR, Black BE. Epigenetic centromere specification directs aurora B accumulation but is insufficient to efficiently correct mitotic errors. The Journal of Cell Biology. 2010;190:177–185. - PMC - PubMed
    1. Bergmann JH, guez MGOMRI, Martins NMC, Kimura H, Kelly DA, Masumoto H, Larionov V, Jansen LET, Earnshaw WC. Epigenetic engineering shows H3K4me2 is required for HJURP targeting and CENP-A assembly on a synthetic human kinetochore. The EMBO Journal. 2010;30:328–340. - PMC - PubMed
    1. Black BE, Brock MA, Bédard S, Woods VL, Cleveland DW. An epigenetic mark generated by the incorporation of CENP-A into centromeric nucleosomes. PNAS. 2007a;104:5008–5013. - PMC - PubMed

Publication types