

Ozone-induced stomatal sluggishness changes carbon and water balance of temperate deciduous forests
- PMID: 25943276
- PMCID: PMC4421795
- DOI: 10.1038/srep09871
Ozone-induced stomatal sluggishness changes carbon and water balance of temperate deciduous forests
Abstract
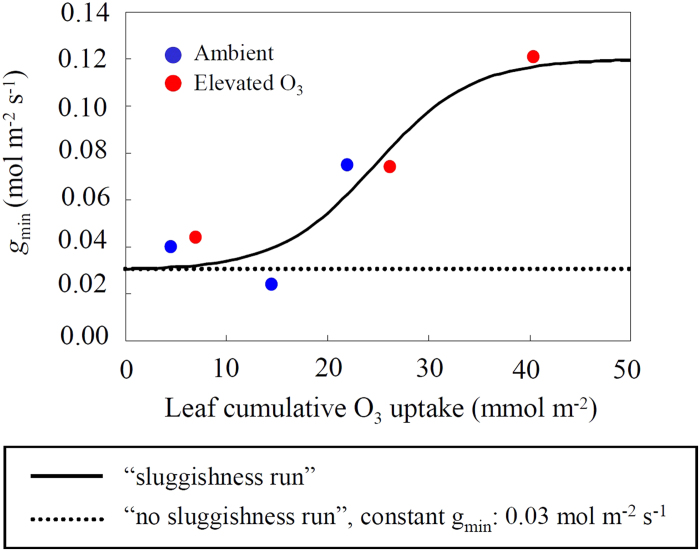
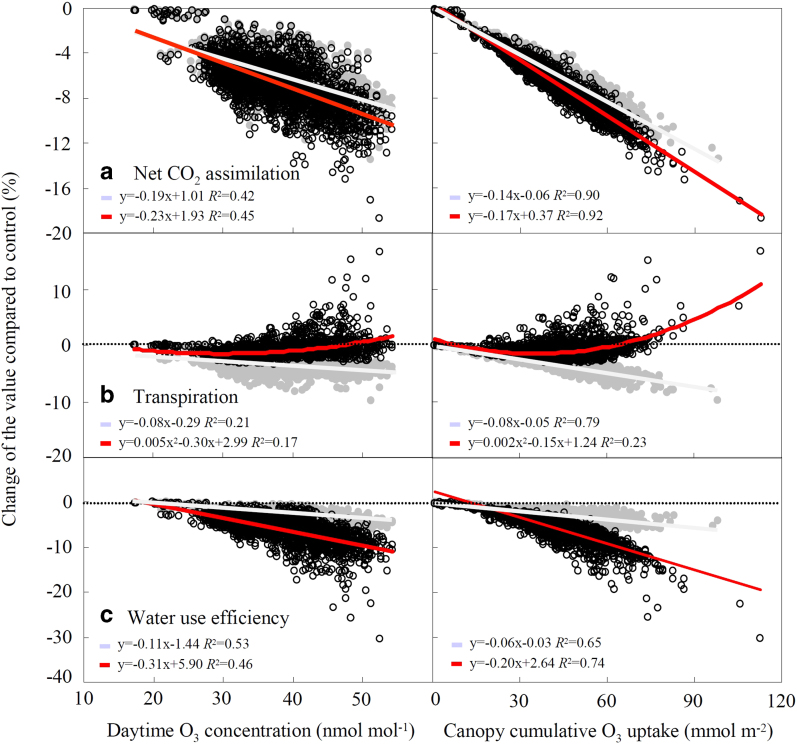
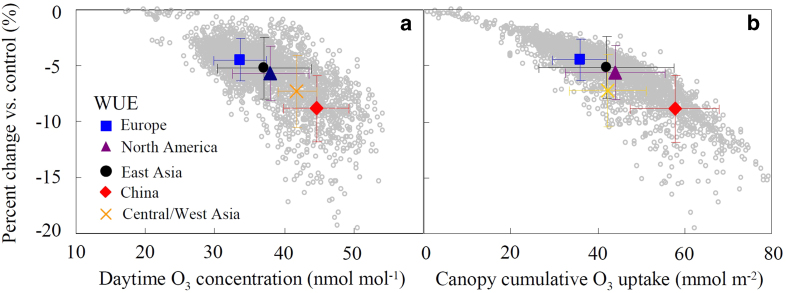
Tropospheric ozone concentrations have increased by 60-100% in the Northern Hemisphere since the 19(th) century. The phytotoxic nature of ozone can impair forest productivity. In addition, ozone affects stomatal functions, by both favoring stomatal closure and impairing stomatal control. Ozone-induced stomatal sluggishness, i.e., a delay in stomatal responses to fluctuating stimuli, has the potential to change the carbon and water balance of forests. This effect has to be included in models for ozone risk assessment. Here we examine the effects of ozone-induced stomatal sluggishness on carbon assimilation and transpiration of temperate deciduous forests in the Northern Hemisphere in 2006-2009 by combining a detailed multi-layer land surface model and a global atmospheric chemistry model. An analysis of results by ozone FACE (Free-Air Controlled Exposure) experiments suggested that ozone-induced stomatal sluggishness can be incorporated into modelling based on a simple parameter (gmin, minimum stomatal conductance) which is used in the coupled photosynthesis-stomatal model. Our simulation showed that ozone can decrease water use efficiency, i.e., the ratio of net CO2 assimilation to transpiration, of temperate deciduous forests up to 20% when ozone-induced stomatal sluggishness is considered, and up to only 5% when the stomatal sluggishness is neglected.
Figures
References
-
- Intergovernmental Panel on Climate Change (IPCC). Fifth Assessment Report. (2013) http://www.ipcc.ch/report/ar5/index.shtml. (Date of access: 08/01/2015)
-
- Monks P. S. et al. Atmospheric composition change – Global and regional air quality. Atmos. Environ. 43, 5268–5350 (2009).
-
- Vingarzan R. A review of surface ozone background levels and trends. Atmos. Environ. 38, 3431–3442 (2004).
-
- Young P. J. et al. Pre-industrial to end 21st century projections of tropospheric ozone from the Atmospheric Chemistry and Climate Model Intercomparison Project. Atmos. Chem. Phys. 13, 2063–2090 (2013).
-
- Sitch S., Cox P. M., Collins W. J. & Huntingford C. Indirect radiative forcing of climate change through ozone effects on the land-carbon sink. Nature 448, 791–795 (2007). - PubMed
Publication types
MeSH terms
Substances
LinkOut - more resources
Full Text Sources
Other Literature Sources
