. 2015 May 15;29(10):1058-73.
doi: 10.1101/gad.259432.115. Epub 2015 May 5.

Structural transitions of centromeric chromatin regulate the cell cycle-dependent recruitment of CENP-N

Affiliations

Structural transitions of centromeric chromatin regulate the cell cycle-dependent recruitment of CENP-N

Junnan Fang et al. Genes Dev. .

Abstract

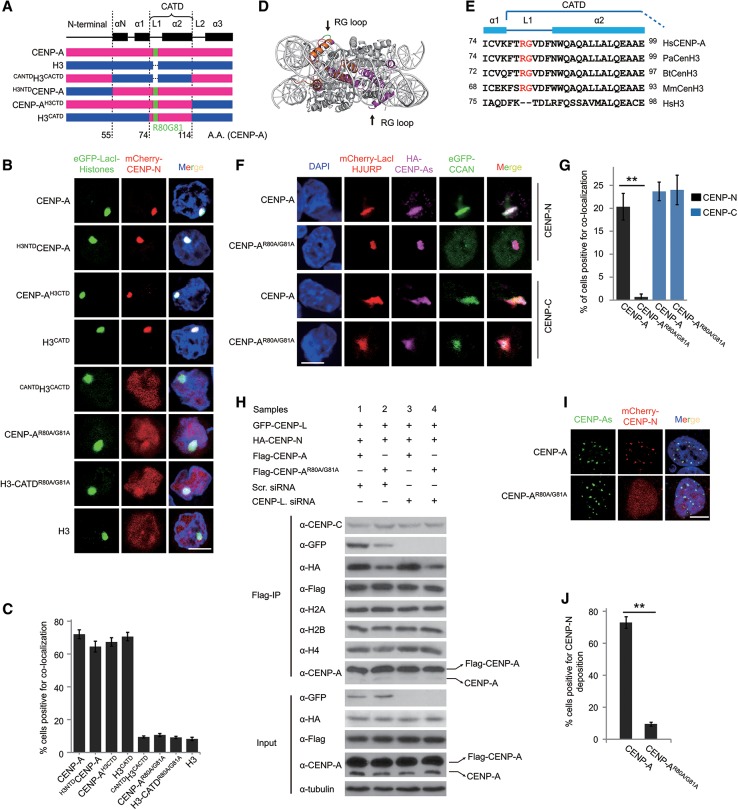
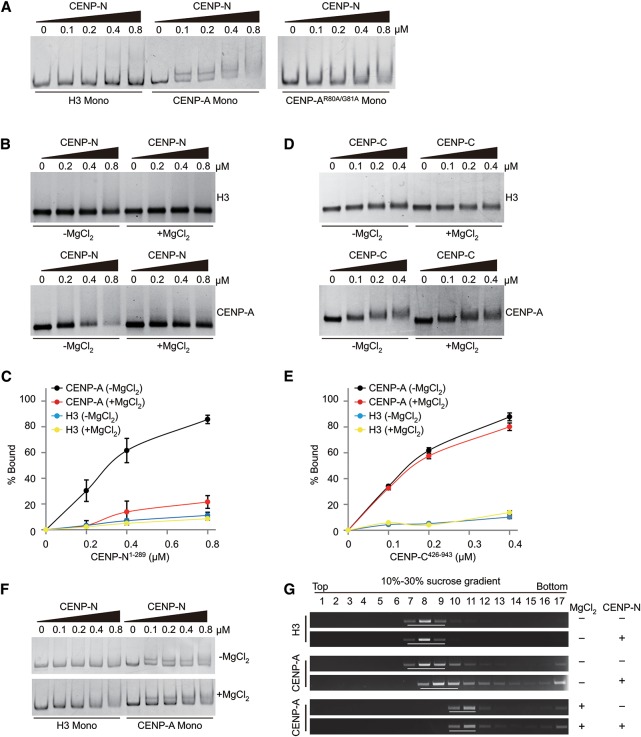
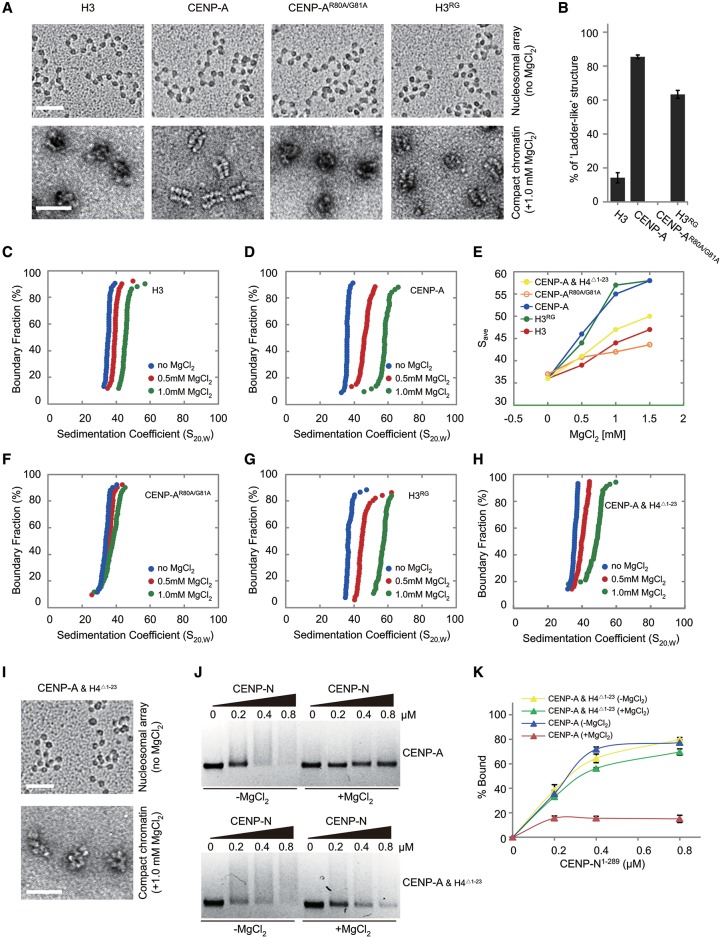
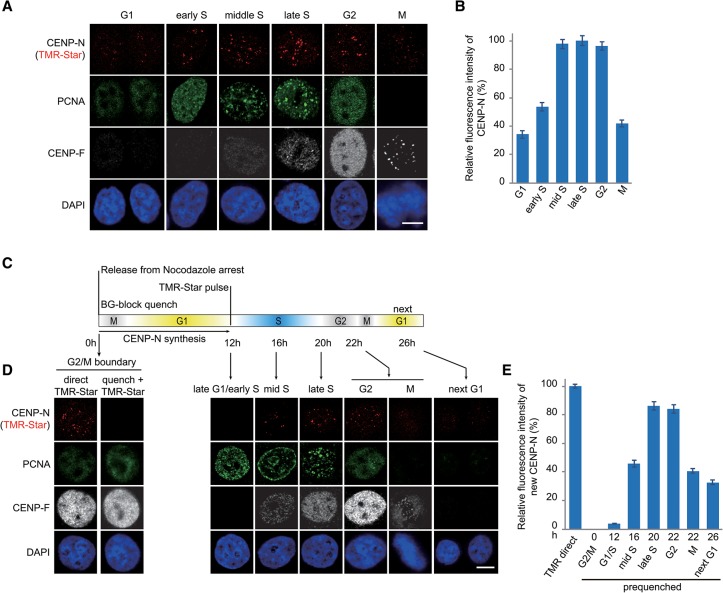
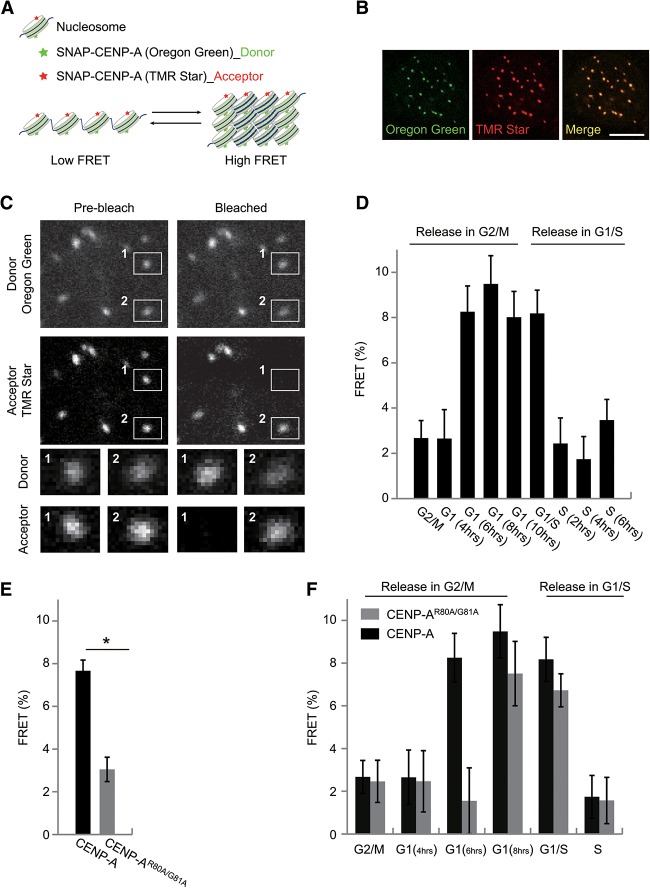
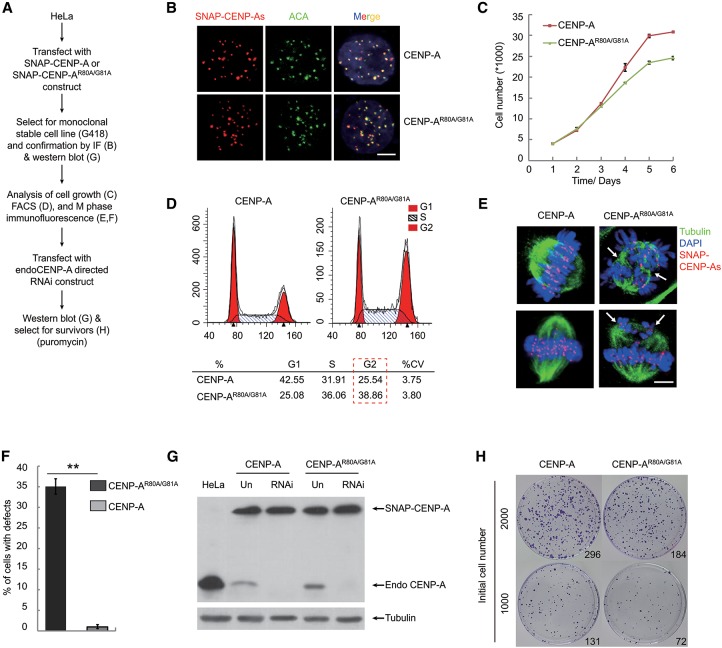
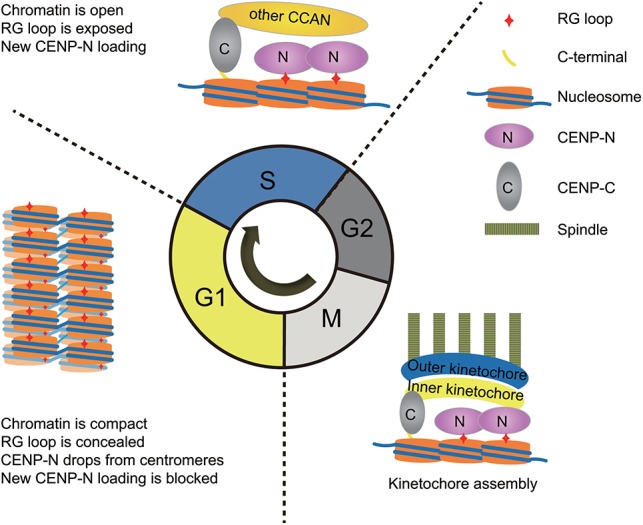
Specific recognition of centromere-specific histone variant CENP-A-containing chromatin by CENP-N is an essential process in the assembly of the kinetochore complex at centromeres prior to mammalian cell division. However, the mechanisms of CENP-N recruitment to centromeres/kinetochores remain unknown. Here, we show that a CENP-A-specific RG loop (Arg80/Gly81) plays an essential and dual regulatory role in this process. The RG loop assists the formation of a compact "ladder-like" structure of CENP-A chromatin, concealing the loop and thus impairing its role in recruiting CENP-N. Upon G1/S-phase transition, however, centromeric chromatin switches from the compact to an open state, enabling the now exposed RG loop to recruit CENP-N prior to cell division. Our results provide the first insights into the mechanisms by which the recruitment of CENP-N is regulated by the structural transitions between compaction and relaxation of centromeric chromatin during the cell cycle.

Keywords: CENP-A; CENP-N; RG loop; cell cycle; chromosome congression; higher-order chromatin structure.


Figures

Figure 1.
Figure 1.
The RG loop plays a key role in the recruitment of CENP-N (see also Supplemental Figs. S1, S2). (A) A schematic depiction of the junctions of the CENP-A (red) and H3 (blue) chimeras. CENP-A domains, R80G81 residues, and amino acid positions are also indicated. (B) CENP-N targeting assay. Representative images of A03_1 cells transfected with mCherry-CENP-N (red) along with eGFP-LacI-CENP-A, H3, or the indicated chimeras and mutants (green) and stained with DAPI (blue). Bar, 10 µm. (C) Statistical analysis of the proportion of cells with colocalization as shown in B. (D) Side view of CENP-A nucleosome, with the CENP-A molecule shown in magenta, and superimposition of CENP-A (magenta) and H3 (orange) L1 regions. Arrows indicate the tip of the CENP-A L1 containing Arg80 and Gly81 residues (green). (E) ClustalX2 alignment of the CATD domain in CENP-A orthologs from Homo sapiens (Hs), Pongo abelii (Pa), Bos taurus (Bt), and Mus musculus (Mm) and the corresponding region in human histone H3. Residues R80G81 are highlighted in red. (F) HJURP-tethering CCAN experiments. Representative images of A03_1 cells transfected with mCherry-LacI-HJURP (red) along with HA-CENP-A or HA-CENP-AR80A/G81A (magenta) and eGFP-CENP-N or CENP-C (green) and stained with DAPI (blue). HA-tagged proteins were immunoblotted with an anti-HA antibody. Bar, 10 µm. (G) Statistical analysis of the proportion of cells with colocalization as shown in F. (H) Mononucleosome immunoprecipitation experiments. 293T cells were transfected with constructs or siRNA oligos as indicated. Mononucleosomes were generated and immunoprecipitated with anti-Flag beads and immunoblotted with the indicated antibodies. (I) Overexpression of mCherry-CENP-N in stable HeLa cells expressing SNAP-CENP-A or SNAP-CENP-AR80A/G81A and colocalization analysis. SNAP-CENP-As was labeled with Oregon Green (green). Bar, 10 µm. (J) Statistical analysis of the proportion of cells with colocalization as shown in I.
Figure 2.
Figure 2.
CENP-N specifically binds to open CENP-A chromatin but not to compact CENP-A chromatin (see also Supplemental Fig. S3). (A) In vitro mononucleosome-binding assay. Mononucleosomes (0.15 µM) were incubated with His-CENP-N1–289mono in different amounts and separated by 6% native PAGE gel. (B) In vitro polynucleosome-binding assay. Polynucleosomes (0.15 µM) were incubated with His-CENP-N1–289 in different amounts and analyzed by 1.0% agarose gel. (C) Statistical analysis of the proportion of nucleosome binding as shown in B. (D) In vitro polynucleosome-binding assay. Polynucleosomes (0.15 µM) were incubated with His-CENP-C426–943 in different amounts and analyzed by 1.0% agarose gel. (E) Statistical analysis for the proportion of nucleosome binding as shown in D. (F) In vitro mononucleosome-binding assay. Mononucleosomes (0.15 µM) were incubated with His-CENP-N1–289 in different amounts in the absence or presence of MgCl2 and analyzed by 6% native PAGE gel. (G) In vitro polynucleosome-binding and sucrose gradient assay. Chromatin was incubated with His-CENP-N1–289 in a molar ratio of 1:2 and analyzed by sucrose gradient sedimentation. Each sample was fractionated by sucrose gradient centrifugation, and DNA collected from individual fractions was sized on agarose gel.
Figure 3.
Figure 3.
Effects of CENP-A on the folding of chromatin arrays (see also Supplemental Figs. S4, S5). (A) EM images of the canonical H3-containing, CENP-A-containing, CENP-AR80A/G81A-containing, and H3RG-containing nucleosomal arrays (by metal-shadowing method; bar, 50 nm) and their related compact states in 1.0 mM MgCl2 (by negatively stained method; bar, 100 nm). (B) Statistical analysis of the proportion of chromatin in “ladder-like” conformation as shown in A. (C,D) Sedimentation coefficient distribution plots for canonical H3-containing and CENP-A-containing nucleosomal arrays in 0, 0.5, and 1.0 mM MgCl2. (E) The Save values of the nucleosomal arrays containing CENP-A and H4Δ1–23, CENP-AR80A/G81A, and H3RG compared with the ones containing wild-type CENP-A or H3. (FH) Sedimentation coefficient distribution plots for CENP-AR80A/G81A-containing, H3RG-containing, and CENP-A/HAΔ1–23-containing nucleosomal arrays in 0, 0.5, and 1.0 mM MgCl2. (I) EM images of the CENP-A/HAΔ1–23-containing nucleosomal arrays (by metal-shadowing method; bar, 50 nm) and their related compact states in 1.0 mM MgCl2 (by negatively stained method; bar, 100 nm). (J) In vitro polynucleosome-binding assay. Polynucleosomes (0.15 µM) containing CENP-A or CENP-A/HAΔ1–23 were incubated with His-CENP-N1–289 in different amounts in the absence or presence of 1.0 mM MgCl2 and analyzed by 1.0% agarose gel. (K) Statistical analysis of the proportion of nucleosome binding as shown in J.
Figure 4.
Figure 4.
Specific loading of CENP-N in middle/late S phase (see also Supplemental Fig. S6). (A) Representative images of HeLa cells expressing SNAP-CENP-N in different cell cycle phases. SNAP-CENP-N was labeled with TMR-Star (red), and cell cycle phases were determined by combined staining with CENP-F antibody (gray), PCNA antibody (green), and DAPI (blue). Bar, 10 µm. (B) Statistical analysis of the relative fluorescence intensity of SNAP-CENP-N during the cell cycle as shown in A. (C) Outline of cell synchronization and the labeling regimen for CENP-N loading. (D) HeLa cells expressing SNAP-CENP-N (red) were synchronized and labeled as depicted in C, and cell cycle phases were determined by combined staining with CENP-F antibody (gray), PCNA antibody (green), and DAPI (blue). Bar, 10 µm. (E) Statistical analysis of relative fluorescence intensity of SNAP-CENP-N newly synthesized and deposited onto centromeres as shown in D.
Figure 5.
Figure 5.
Centromeric chromatin structure changes in a cell cycle-dependent manner (see also Supplemental Figs. S7, S8). (A) Schematic diagram of FRET relative to chromatin structure. The closer the distance between donor and acceptor, the higher the FRET signals that are obtained. The distance between donor and acceptor could reflect the chromatin structure. (B) Representative images of HeLa cells expressing SNAP-CENP-A colabeled with Oregon Green (green) and TMR-Star (red). Bar, 10 µm. (C) Schematic diagram of AB-FRET. Two locations in centromeres/kinetochores, 1 and 2, were selected for fluorescence intensity analysis before and after acceptor bleaching (see enlargement below). At spot 1, the acceptor fluorophore was bleached, and the fluorescence intensity of donor emission increased, indicating that FRET occurred between TMR-labeled CENP-A and Oregon Green-labeled CENP-A. Spot 2 was not photobleached and served as an intrinsic control for non-FRET effect. (D) FRET measurements between CENP-A nucleosomes in HeLa cells expressing SNAP-CENP-A throughout the cell cycle. (E) FRET measurements between CENP-AR80A/G81A nucleosomes in HeLa cells expressing SNAP-CENP-AR80A/G81A compared with that between CENP-A nucleosomes in HeLa cells expressing SNAP-CENP-A. (F) FRET measurements between CENP-A or CENP-AR80A/G81A nucleosomes in HeLa cells expressing SNAP-CENP-A or SNAP-CENP-AR80A/G81A throughout the cell cycle.
Figure 6.
Figure 6.
Functions of the RG loop in ensuring cell proliferation and chromosome congression (see also Supplemental Fig. S9). (A) Schemes for construction of stable HeLa cell lines expressing SNAP-CENP-A or SNAP-CENP-AR80A/G81A and depletion of endogenous CENP-A. (B) Centromere localization of exogenous SNAP-CENP-As. SNAP tag was labeled with TMR-Star (red), and the centromere was detected with ACA (green). Bar, 10 µm. (CE) Cell growth analysis (C), FACS analysis (D), and representative M-phase immunofluorescence images (E) of HeLa cells expressing SNAP-CENP-A or SNAP-CENP-AR80A/G81A. Cells were stained with TMR-Star (for CENP-A; red), tubulin (for microtubule; green), and DAPI (for DNA; blue). Bar, 10 µm. (F) Statistical analysis of the proportion of cells with M-phase defects in chromosome congression as shown in E. (G) Western blot assay to detect the amounts of endogenous and exogenous CENP-As before and after depletion of endogenous CENP-A in stable HeLa cells expressing SNAP-CENP-A or SNAP-CENP-AR80A/G81A, respectively. (H) Colony outgrowth assay in the stable HeLa cells expressing SNAP-CENP-A or SNAP-CENP-AR80A/G81A after depletion of endogenous CENP-A. The numbers at the left indicate the numbers of initial cells, while the numbers in the image indicate the numbers of surviving clones.
Figure 7.
Figure 7.
Model for structural transitions of centromeric chromatin regulating the cell cycle-dependent recruitment of CENP-N via modulating the accessibility of the RG loop of CENP-A.

References

    1. Allshire RC, Karpen GH. 2008. Epigenetic regulation of centromeric chromatin: old dogs, new tricks? Nat Rev Genet 9: 923–937. - PMC - PubMed
    1. Arimura Y, Shirayama K, Horikoshi N, Fujita R, Taguchi H, Kagawa W, Fukagawa T, Almouzni G, Kurumizaka H. 2014. Crystal structure and stable property of the cancer-associated heterotypic nucleosome containing CENP-A and H3.3. Sci Rep 4: 7115. - PMC - PubMed
    1. Barnhart MC, Kuich PHJL, Stellfox ME, Ward JA, Bassett EA, Black BE, Foltz DR. 2011. HJURP is a CENP-A chromatin assembly factor sufficient to form a functional de novo kinetochore. J Cell Biol 194: 229–243. - PMC - PubMed
    1. Bassett EA, DeNizio J, Barnhart-Dailey MC, Panchenko T, Sekulic N, Rogers DJ, Foltz DR, Black BE. 2012. HJURP uses distinct CENP-A surfaces to recognize and to stabilize CENP-A/histone H4 for centromere assembly. Dev Cell 22: 749–762. - PMC - PubMed
    1. Black BE, Cleveland DW. 2011. Epigenetic centromere propagation and the nature of CENP-A nucleosomes. Cell 144: 471–479. - PMC - PubMed

Publication types