. 2015 May 6;16(1):357.
doi: 10.1186/s12864-015-1594-1.

Genomic landscape of rat strain and substrain variation

Affiliations

Genomic landscape of rat strain and substrain variation

Roel Hermsen et al. BMC Genomics. .

Abstract

Background: Since the completion of the rat reference genome in 2003, whole-genome sequencing data from more than 40 rat strains have become available. These data represent the broad range of strains that are used in rat research including commonly used substrains. Currently, this wealth of information cannot be used to its full extent, because the variety of different variant calling algorithms employed by different groups impairs comparison between strains. In addition, all rat whole genome sequencing studies to date used an outdated reference genome for analysis (RGSC3.4 released in 2004).

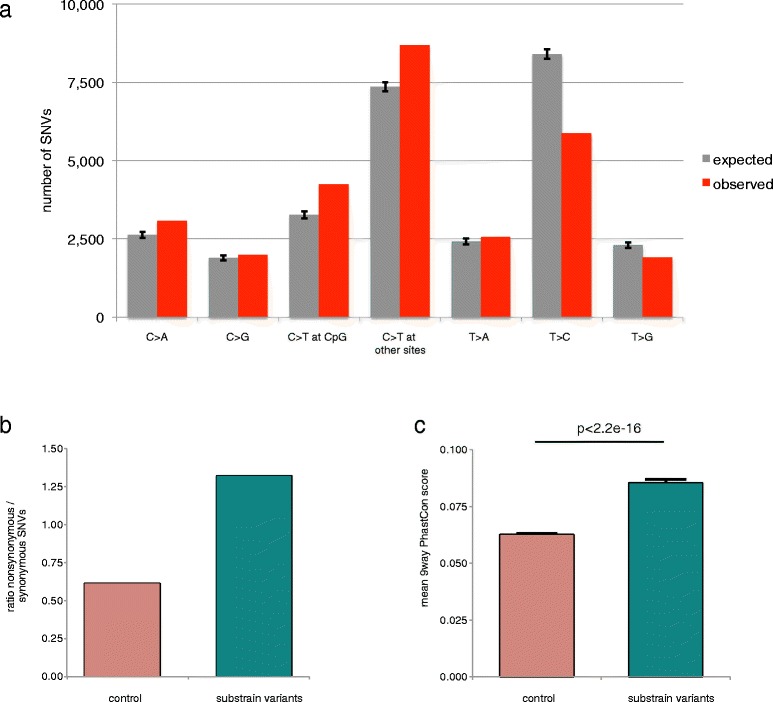
Results: Here we present a comprehensive, multi-sample and uniformly called set of genetic variants in 40 rat strains, including 19 substrains. We reanalyzed all primary data using a recent version of the rat reference assembly (RGSC5.0 released in 2012) and identified over 12 million genomic variants (SNVs, indels and structural variants) among the 40 strains. 28,318 SNVs are specific to individual substrains, which may be explained by introgression from other unsequenced strains and ongoing evolution by genetic drift. Substrain SNVs may have a larger predicted functional impact compared to older shared SNVs.

Conclusions: In summary we present a comprehensive catalog of uniformly analyzed genetic variants among 40 widely used rat inbred strains based on the RGSC5.0 assembly. This represents a valuable resource, which will facilitate rat functional genomic research. In line with previous observations, our genome-wide analyses do not show evidence for contribution of multiple ancestral founder rat subspecies to the currently used rat inbred strains, as is the case for mouse. In addition, we find that the degree of substrain variation is highly variable between strains, which is of importance for the correct interpretation of experimental data from different labs.


Figures

Figure 1
Figure 1
‘Repression’ of genes and exons containing high impact SNVs. (a) Genome-wide average FPKM ± SEM across all tissues compared to the average FPKM of genes containing high impact SNVs for 12 tissues. Genes containing high impact SNVs are significantly lower expressed (Non-parametric ANOVA; p < 0.0001). (b) The average Percentage Spliced In (PSI) ± SEM across the transcriptome was compared to the average PSI of exons containing high impact SNVs for 12 tissues. Exons containing high impact SNVs are significantly more spliced out/not used (Non-parametric ANOVA; P < 0.0001).
Figure 2
Figure 2
Cross-species comparison of SNV densities. (a) An example of a locus (black rectangle) on mouse chromosome 9 with the lowest SNV density in five domesticated species. (b) An example of a locus (black rectangle) on mouse chromosome 4 with the highest SNV density in five domesticated species.
Figure 3
Figure 3
‘Population’ structure of 40 + 1 rat strains. (a) Per strain, the contribution from the 9 different clusters is plotted as percentage of the genome. Each cluster is represented by a separate color. The cluster designated with a ‘m’ represents the strains that have membership from multiple clusters. (b) Per strain, the genomic distribution along rat chromosome 1 is plotted as an example. The colors match the cluster colors from (a).
Figure 4
Figure 4
Genomic distribution of substrain variants per strain. For each strain the distance between two consecutive SNVs (y-axis) is plotted along the genomic position (x-axis). The windows on the x-axis represent the different chromosomes. Loci with a high density of substrain SNVs can be observed as clusters that drop down from the average genome-wide pattern.
Figure 5
Figure 5
Substrain variant characteristics. (a) Bar plots showing the contribution of each nucleotide change for all substrain variants (observed) versus the control variants (expected). Error bars represent the 95% confidence interval. (b) Bar plot showing the Ka/Ks ratio ratio of the substrain variants versus the control variants. (c) Bar plot showing the average phastCons score for each substrain variant compared to the control variants. Substrain variants affect nucleotides with a significantly higher phastCons score (Student’s t-test; p < 2.2e-16). Error bars represent the SEM.

References

    1. Jacob HJ. Functional genomics and rat models. Genome Res. 1999;9(11):1013–6. doi: 10.1101/gr.9.11.1013. - DOI - PubMed
    1. Bosse JD, Lin HY, Sloan C, Zhang QJ, Abel ED, Pereira TJ, et al. A low-carbohydrate/high-fat diet reduces blood pressure in spontaneously hypertensive rats without deleterious changes in insulin resistance. Am J Physiol Heart Circ Physiol. 2013;304(12):H1733–42. doi: 10.1152/ajpheart.00631.2012. - DOI - PMC - PubMed
    1. Diness JG, Skibsbye L, Jespersen T, Bartels ED, Sorensen US, Hansen RS, et al. Effects on atrial fibrillation in aged hypertensive rats by Ca(2+)-activated K(+) channel inhibition. Hypertension. 2011;57(6):1129–35. doi: 10.1161/HYPERTENSIONAHA.111.170613. - DOI - PubMed
    1. Sagvolden T, Dasbanerjee T, Zhang-James Y, Middleton F, Faraone S. Behavioral and genetic evidence for a novel animal model of Attention-Deficit/Hyperactivity Disorder Predominantly Inattentive Subtype. Behav Brain Funct. 2008;4:56. doi: 10.1186/1744-9081-4-56. - DOI - PMC - PubMed
    1. Saar K, Beck A, Bihoreau MT, Birney E, Brocklebank D, Chen Y, et al. SNP and haplotype mapping for genetic analysis in the rat. Nat Genet. 2008;40(5):560–6. doi: 10.1038/ng.124. - DOI - PMC - PubMed

Publication types

LinkOut - more resources