. 2015 Jul 1;43(W1):W30-8.
doi: 10.1093/nar/gkv397. Epub 2015 May 5.

HMMER web server: 2015 update

Affiliations

HMMER web server: 2015 update

Robert D Finn et al. Nucleic Acids Res. .

Abstract

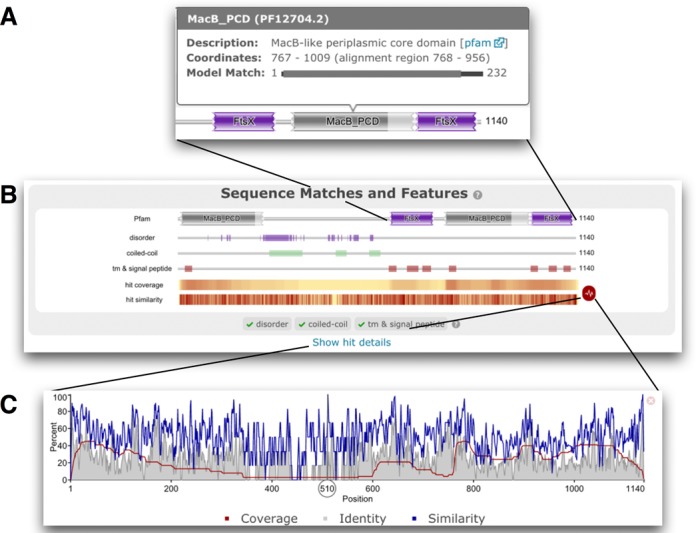
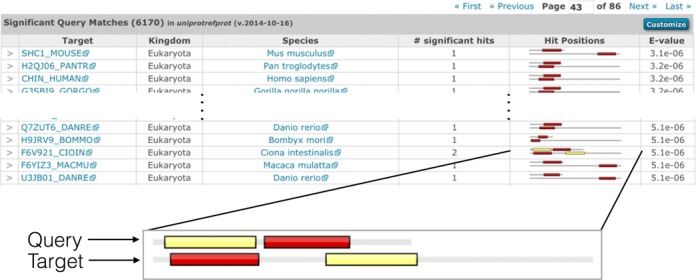
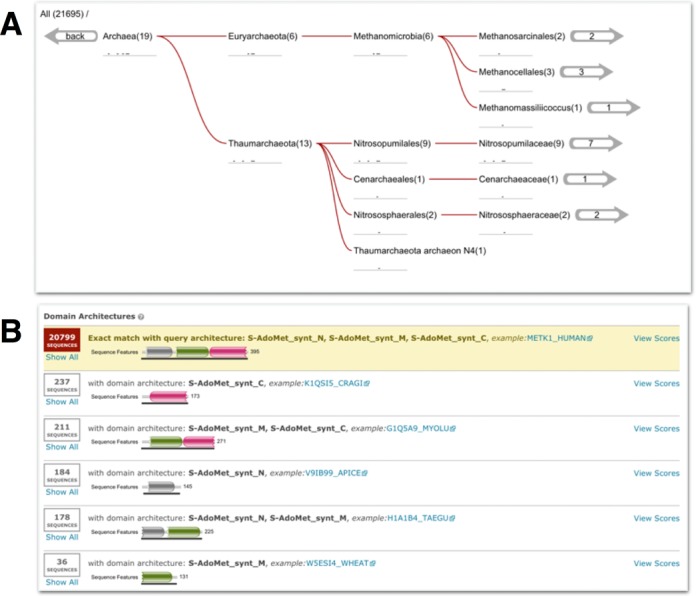
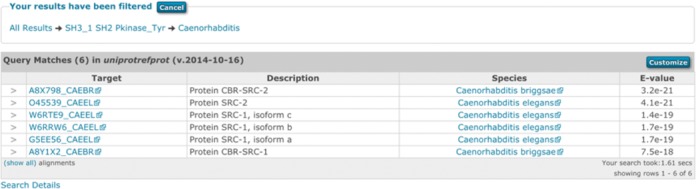
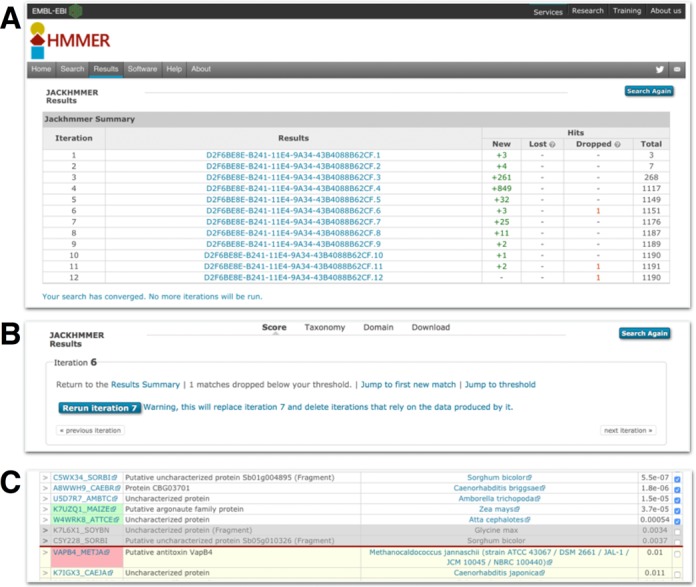
The HMMER website, available at http://www.ebi.ac.uk/Tools/hmmer/, provides access to the protein homology search algorithms found in the HMMER software suite. Since the first release of the website in 2011, the search repertoire has been expanded to include the iterative search algorithm, jackhmmer. The continued growth of the target sequence databases means that traditional tabular representations of significant sequence hits can be overwhelming to the user. Consequently, additional ways of presenting homology search results have been developed, allowing them to be summarised according to taxonomic distribution or domain architecture. The taxonomy and domain architecture representations can be used in combination to filter the results according to the needs of a user. Searches can also be restricted prior to submission using a new taxonomic filter, which not only ensures that the results are specific to the requested taxonomic group, but also improves search performance. The repertoire of profile hidden Markov model libraries, which are used for annotation of query sequences with protein families and domains, has been expanded to include the libraries from CATH-Gene3D, PIRSF, Superfamily and TIGRFAMs. Finally, we discuss the relocation of the HMMER webserver to the European Bioinformatics Institute and the potential impact that this will have.


Figures

Figure 1.
Figure 1.
Results of searching the Efflux ABC transporter permease protein from Enterococcus casseliflavus ATCC 12755 (UniProtKB accession F0EMD7) against the Reference Proteome database using phmmer with default search options. (A) The tool tip associated with the partial C-terminal MacB_PCD domain match. The model match line indicates the region of the HMM to which the sequence has been aligned (alignment region). While the match is incomplete, in this particular case, >90% of the model positions have been matched. (B) Shows the Pfam matches on the query and other sequence features. The hit coverage and similarity are shown in a condensed heat map style view below the sequence features. These can be expanded using the red icon to their right. (C) The hit similarity and coverage graph, summarising the phmmer matches.
Figure 2.
Figure 2.
Example of the expanded results table, showing the kingdom and species, number of significant hits, and the hit positions between the query and the target sequences after searching the UniProtKB sequence accession P00519 (amino acids 57 to 218) against the UniProtKB reference proteomes sequences (2014_10 release). The customise button in the top-right of the table header can be used to switch on different columns in that table (row count, secondary accessions, description, species, kingdom, known structure, number of identical sequences, number of hits, number of significant hits, bit score and graphical representation of the hit position). An expanded view of the hit position graphic is shown below the table. The enlarged view indicates where the two regions of similarity, or hits, in the query sequence match the target sequence. Each distinct hit of the query sequence is shown as a coloured box, and the corresponding aligned region is represented by a box of the same colour. The two sequences in each row are drawn proportionally to each other, with the sequence represented as a grey line. The two sequences are drawn left-justified (i.e. unaligned), with the query sequence always shown above the target. In this particular case, the order of the hits is reversed between the query and target sequences. A similar representation is used for queries with a profile HMM, with the top image (the query) representing the length of the profile HMM. The hit graphic quickly allows the identification of sequence rearrangements and repeated regions (where hit/coloured box in the query is duplicated multiple times in the target sequence).
Figure 3.
Figure 3.
Two different results view from searching the human S-adenosylmethionine synthase sequence (UniProtKB accession Q00266) against UniProtKB (2014_10 release). (A) The taxonomic distribution of the archaeal homologs in the results. Below each taxonomic name is a sparkline version of the hit graphic showing the hit distribution of all sequences belonging to that taxonomic clade. The numbers in brackets denote the number of sequences matched, while the numbers in the right-hand arrows indicate the number of species. (B) The same results as in (A), but grouped according to domain architecture. In this example, 20 799 out of the 21 695 match sequences have the same domain architecture as the query (as indicated by the yellow background). The remaining domain architectures appear to be subsets of the dominant domain architecture, arising from sequence fragments found in the database.
Figure 4.
Figure 4.
An example of filtered search results using both domain architecture and taxonomic filters (described in the text). The box above the table shows the filtering steps, first restricting by the domain architecture ‘SH3_1 SH2 Pkinase_Tyr’ then by a taxonomy filter. The user can click the filter labels in the breadcrumb string (‘All Results') in the filter section to reverse any of the steps to the right, or all filters can be cancelled by clicking the cancel button.
Figure 5.
Figure 5.
Examples of the jackhmmer user interface. (A) This shows the summary table of a jackhmmer search that has been iterated to convergence. Each iteration is compared to the previous stage and shows the number of new sequences found compared to the previous iteration, the number of sequences lost (see text for details), the number of sequences that were dropped and the total number of sequences. The results job identifier in the second column provides a link through to the results table for that iteration. At the top of the results page for a specific iteration, there is an ‘iteration’ box (B). This provides information about the iteration and a series of links to navigate to the summary page, or previous or next iteration results, to re-run iterations or to navigate the results. If any sequences have been lost, a link to a table listing those sequences is provided. (C) Shows the results on either side of the inclusion threshold (red horizontal line). The rows containing sequence accessions with a green background indicate new sequences that were not previously above threshold. The row containing a sequence accession with a pink background is a sequence that is no longer significant, but was in the previous iteration, i.e. dropped. The grey rows indicate the sequences that have been manually de-selected by the user and will not be used in the subsequent iteration.

References

    1. Krogh A., Brown M., Mian I.S., Sjölander K., Haussler D. Hidden Markov models in computational biology: Applications to protein modeling. J. Mol. Biol. 1994;235:1501–1531. - PubMed
    1. Eddy S.R. Profile hidden Markov models. Bioinformatics. 1998;14:755–763. - PubMed
    1. Altschul S.F. Amino acid substitution matrices from an information theoretic perspective. J. Mol. Biol. 1991;219:555–565. - PMC - PubMed
    1. Henikoff S., Henikoff J.G. Amino acid substitution matrices from protein blocks. Proc. Natl. Acad. Sci. U.S.A. 1992;89:10915–10919. - PMC - PubMed
    1. Finn R.D., Clements J., Eddy S.R. HMMER web server: interactive sequence similarity searching. Nucleic Acids Res. 2011;39:W29–W37. - PMC - PubMed

Publication types