. 2015 May 6:6:7006.
doi: 10.1038/ncomms8006.

Prdx4 is a compartment-specific H2O2 sensor that regulates neurogenesis by controlling surface expression of GDE2

Affiliations

Prdx4 is a compartment-specific H2O2 sensor that regulates neurogenesis by controlling surface expression of GDE2

Ye Yan et al. Nat Commun. .

Abstract

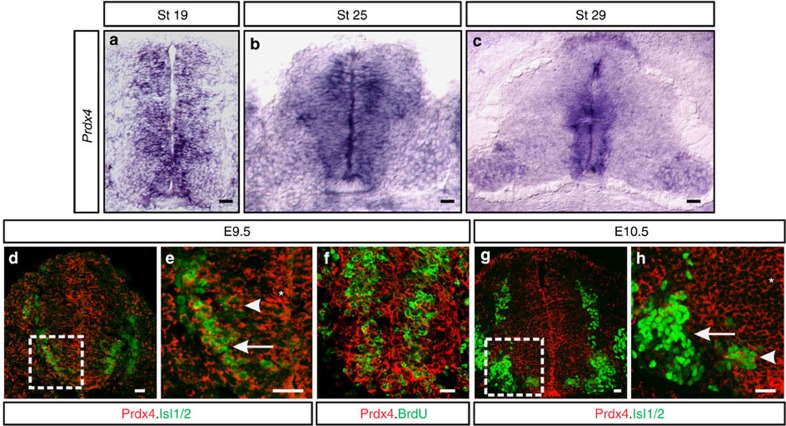
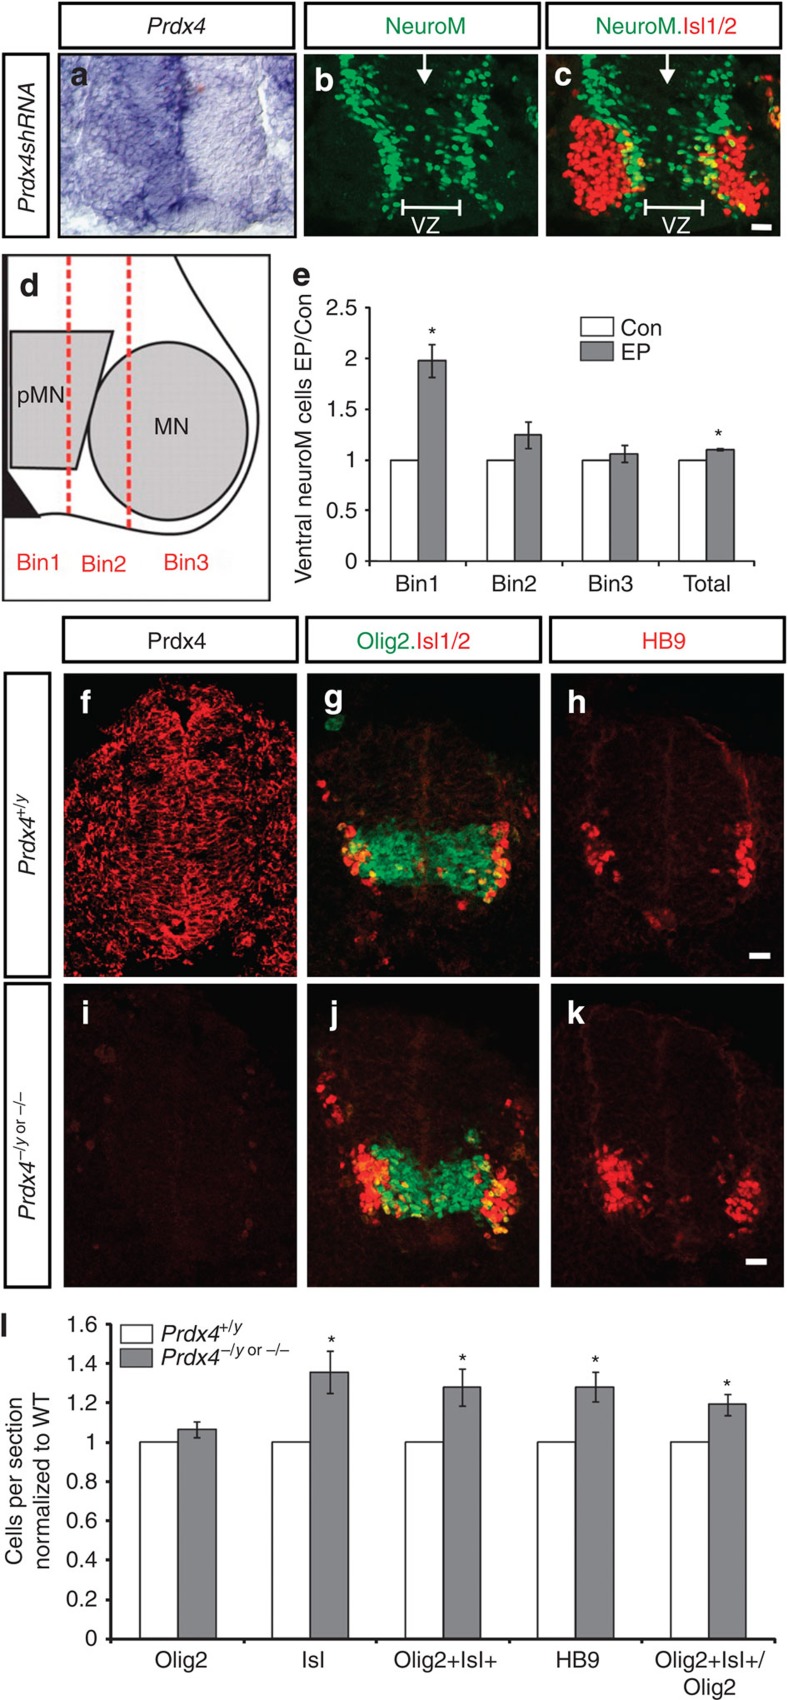
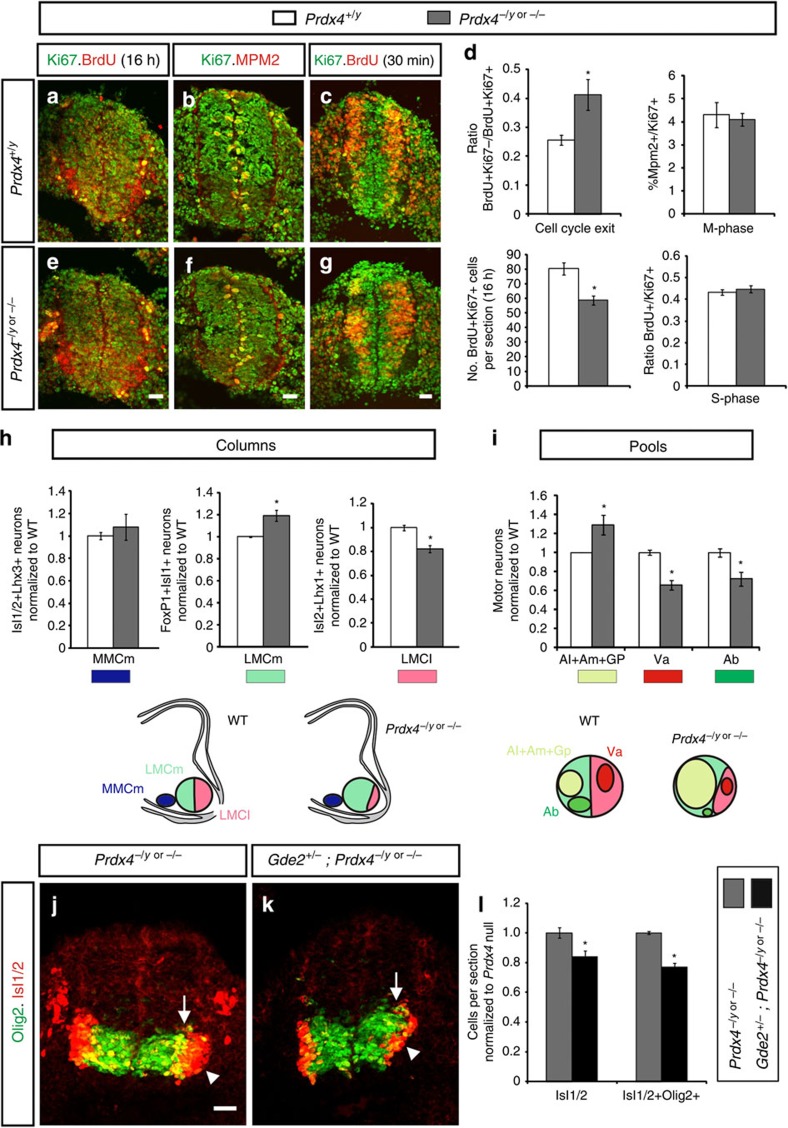
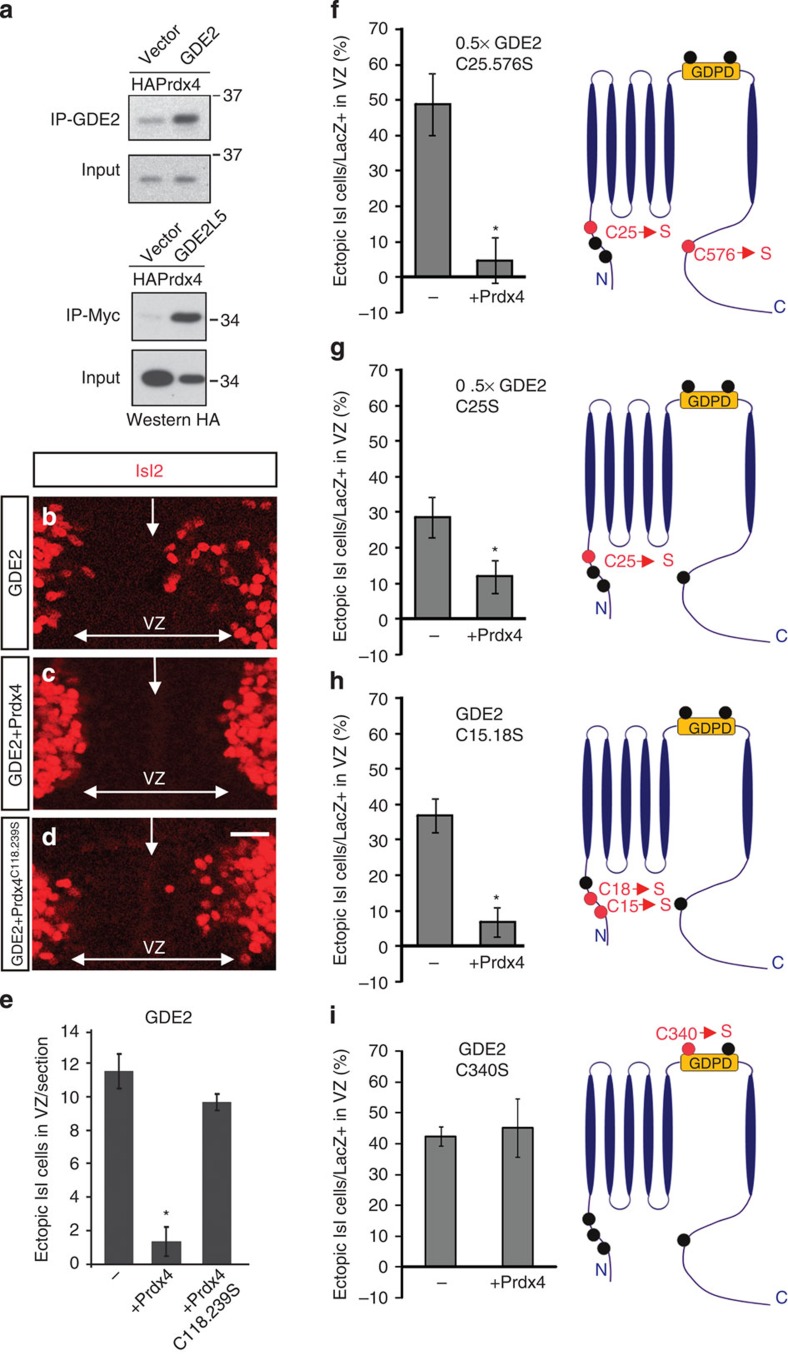
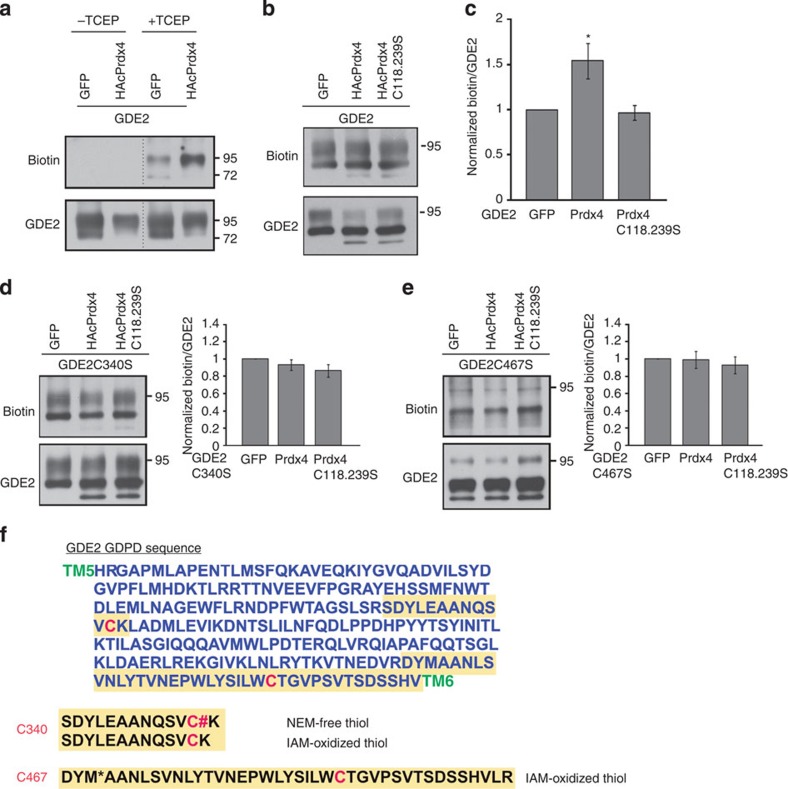
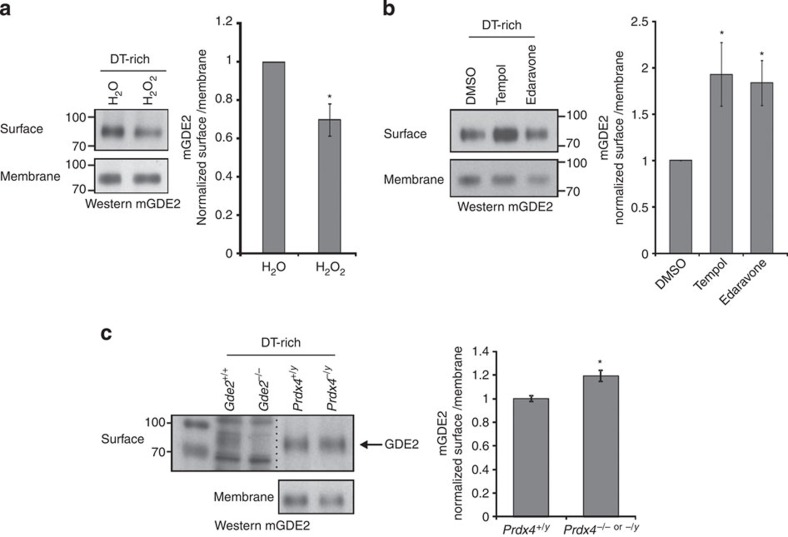
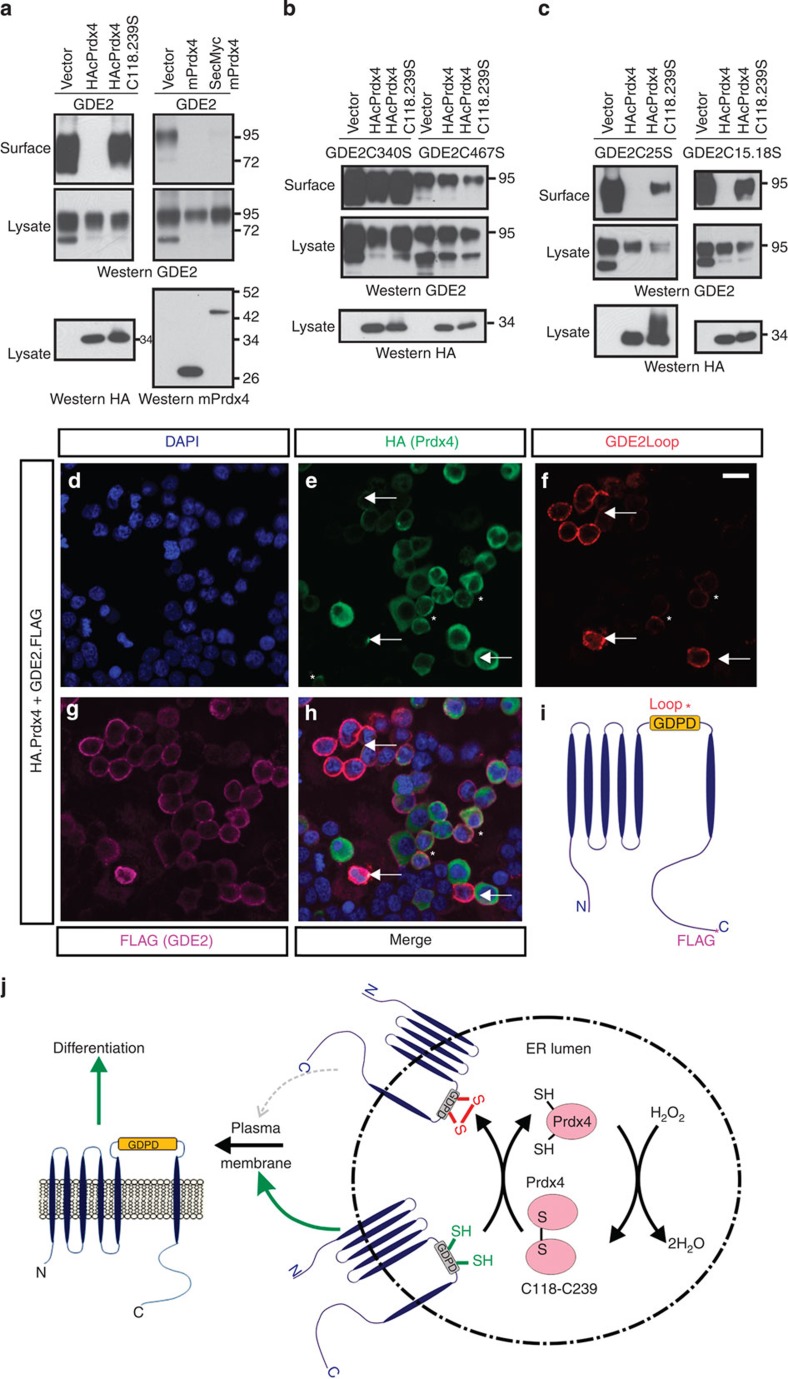
Neural progenitors and terminally differentiated neurons show distinct redox profiles, suggesting that coupled-redox cascades regulate the initiation and progression of neuronal differentiation. Discrete cellular compartments have different redox environments and how they contribute to differentiation is unclear. Here we show that Prdx4, an endoplasmic reticulum (ER) enzyme that metabolizes H2O2, acts as a tunable regulator of neurogenesis via its compartmentalized thiol-oxidative function. Prdx4 ablation causes premature motor neuron differentiation and progenitor depletion, leading to imbalances in subtype-specific motor neurons. GDE2, a six-transmembrane protein that induces differentiation by downregulating Notch signalling through surface cleavage of GPI-anchored proteins, is targeted by Prdx4 oxidative activity. Prdx4 dimers generated by H2O2 metabolism oxidize two cysteine residues within the GDE2 enzymatic domain, which blocks GDE2 trafficking to the plasma membrane and prevents GDE2 neurogeneic function. Thus, Prdx4 oxidative activity acts as a sensor to directly couple neuronal differentiation with redox environments in the ER.


Figures

Figure 1
Figure 1. Prdx4 expression in the developing spinal cord.
(a–c) In situ hybridization of transverse sections of embryonic chick spinal cords shows Prdx4 transcript distribution. (dh) Confocal micrographs of mouse spinal cords show the distribution of Prdx4 protein (red.) Boxes in d and g are magnified in e and h. Prdx4 is expressed in progenitors (*) and in newly differentiating (arrowheads), and postmitotic motor neurons (arrow in e); however Prdx4 is downregulated in terminally differentiated motor neurons at the end of neurogenesis (arrow in h). Scale bars, 20 μm.
Figure 2
Figure 2. Prdx4 ablation triggers early initiation of neurogenesis.
(ac) Close-up of ventral embryonic chick spinal cords electroporated on the right side with Prdx4 shRNAs. (a) In situ hybridization showing effective knockdown of Prdx4 transcripts. (b,c) Antibody stains showing increased NeuroM and decreased Isl1/2+ motor neurons in the absence of Prdx4. VZ, ventricular zone; arrows mark midline. (d) Schematic shows division of lower right quadrant of spinal cord. pMN, motor neuron progenitor domain; MN, motor neurons. (e) Graph shows ratio of NeuroM+ cells in Prdx4 shRNA electroporated (EP) spinal cords compared with the contralateral side (Con). Mean±s.e.m., n=5 embryos; Bin 1 *P=0.0039; Bin 2 P=0.1336; Bin 3 P=0.5132; total *P=0.0005, two-tailed Student's t-test. (fk) Confocal images of transverse sections of E9.5 mouse spinal cords. (l) Graph shows ratio of cells in Prdx4 knockout (KO) embryos compared with WT. Mean±s.e.m., n=4–9 embryos; Olig2+ P=0.1354; Isl1+ *P=0.0109; Olig2+Isl+ *P=0.0189; HB9+ *P=0.0059; Olig2+Isl+/Olig2+ *P=0.0069, two-tailed Student's t-test. Scale bars, 20 μm.
Figure 3
Figure 3. Prdx4 genetically interacts with GDE2 to control the timing of neurogenesis.
(ac,eg) Sections of mouse embryonic spinal cords stained for cell cycle analysis. BrdU labelling was performed 16 h (a,e) or 30 min before analysis (c,g). (d) Graphs quantifying different phases of the cell cycle. Mean±s.e.m., n=3–7 embryos; cell cycle exit *P=0.0321; M-phase P=0.7474; total number of BrdU+Ki67+ cells (16 h) *P=0.0111; S-phase P=0.4660, two-tailed Student's t-test. (h) Graphs quantifying ratios of motor columns compared with WT animals. Mean±s.e.m., n=4–5 embryos; medial median motor column (MMCm) P=0.5395; medial divisions of lateral motor column (LMCm) *P=0.0154; lateral divisions of lateral motor column (LMCl) *P=0.0025; two-tailed Student's t-test; lower panels are schematics showing changes in motor columns in the absence of Prdx4. (i) Graphs quantifying ratios of motor pools compared with WT animals. Mean±s.e.m., n=5–6 embryos; Al (adductor longus)+Am (adductor magnus)+Gp (gracilis posterior) *P=0.0385; Va (vasti) *P=0.0003; Ab (adductor brevis) *P=0.0159; two-tailed Student's t-test; lower panels are schematics showing changes in motor pools in Prdx4 KOs. (j,k) Sections of E9.5 mouse spinal cords. Arrows mark newly differentiating Olig2+Isl+ cells; arrowheads mark postmitotic Isl motor neurons. (l) Graphs quantifying ratios of Olig2+Isl+ cells and Isl+ cells compared with Prdx4 mutant animals. Mean±s.e.m., n=6–8 embryos; Isl+ *P=0.01; Olig2+Isl+ *P=0.0001; two-tailed Student's t-test. Scale bars, 20 μm.
Figure 4
Figure 4. Prdx4 inhibits GDE2 activity by targeting its extracellular Cys residues.
(a) Representative western blot (one of three individual experiments) shows co-IP of Prdx4 and GDE2 using extracts from transfected HEK293T cells. (bd) Close-up of ventral regions of chick spinal cords that are electroporated on the right side. VZ, ventricular zone; arrows mark midline. Scale bars, 20 μm. Graphs quantifying number of Isl1/2+ cells (e) or percentage of LacZ+ cells that are Isl1/2+ (fi) are induced in VZ progenitors. GDE2 expressing constructs were bicistronic for LacZ; LacZ was used as a measure of electroporation efficiency. Mean±s.e.m., schematics on the right show location of Cys residues (black circles) in GDE2, red circles are Cys residues that were mutated to Ser. 0.5 × GDE2 was used in f and g as these versions of GDE2 are hyperactive (e) GDE2+Prdx4 *P=3.7864E-05; GDE2+Prdx4C118.239S P=0.1519; n=4–7 embryos; (f) 0.5 × GDE2C25.576S+Prdx4 *P=0.0009, n=9–12 embryos; (g) 0.5 × GDE2C25S+Prdx4 *P=0.0425, n=5–10 embryos; (h) GDE2C15.18S+Prdx4 *P=0.0003, n=8–9 embryos; (i) GDE2C340S+Prdx4 P=0.7888, n=5–6 embryos, two-tailed Student's t-test.
Figure 5
Figure 5. Prdx4 oxidizes Cys residues within the GDE2 GDPD domain.
(a,b,d,e) Western blots of biotin labelling assays to measure thiol oxidation. (ce) Graph quantifying biotin incorporation normalized to total GDE2, GDE2C340S or GDE2C467S. Mean±s.e.m., n=8–13 different transfection experiments. Compared with GFP (green fluorescent protein) controls, (c) Prdx4 *P=0.0159, Prdx4C118.239S P=0.6955; (d) Prdx4 P=0.3022, Prdx4C118.239S P=0.0854; (e) Prdx4 P=0.9249, Prdx4C118.239S P=0.4988, two-tailed Student's t-test. (f) Sequence of the GDE2 GDPD domain located between transmembrane (TM) regions 5 and 6. Sequences in yellow denote peptides identified by mass spectrometry; C340 and C467 are shown in red.
Figure 6
Figure 6. GDE2 surface expression in motor neurons is redox sensitive and Prdx4 dependent.
(a–c) Western blots of surface biotinylation assays using membrane fractions of primary motor neuron cultures derived from E11.5 spinal cords. In c, arrow marks detection of band corresponding to GDE2, which is absent in Gde2 null animals. Graphs show surface levels of biotinylated GDE2 normalized to total levels of membrane GDE2. Mean±s.e.m., (a) *P=0.003, n=14 separate cultures; (b) Tempol *P=0.021, Edaravone *P=0.006, n=11 separate cultures; (c) *P=0.035, n=9–24 embryos; two-tailed Student's t-test.
Figure 7
Figure 7. Prdx4 oxidative activity blocks GDE2 trafficking.
(ac) Western blots of surface biotinylation assays in transfected HEK293T cells. These are representative of (a) n=7, (b) n=6, (c) n=5–7 different transfection experiments. (dh) Live-cell staining of Prdx4 (green), GDE2 (FLAG, purple) and surface GDE2 (red) in transfected HEK293T cells. Panels represent one of 20 different areas imaged for each experiment. Arrows mark cells with surface GDE2 expression; asterisks (*) marks cells with very low surface GDE2 expression. Scale bar, 20 μm. (i) Schematic diagram of GDE2 showing epitope locations for FLAG and GDE2Loop antibodies utilized in dh. (j) Model of Prdx4 inhibition of GDE2 function. Prdx4 monomers in the ER lumen are oxidized by H2O2 at their redox active C118 and C239 Cys to form dimers; these dimers subsequently oxidize Cys residues in the GDE2 GDPD domain, which inhibits GDE2 surface localization. When Prdx4 dimer levels decrease, the GDE2 GDPD domain escapes oxidation, and GDE2 traffics to the cell surface where it induces neurogenesis of neighbouring progenitors by GPI-anchor cleavage.

Similar articles

Cited by

References

    1. Wang K. et al. Redox homeostasis: the linchpin in stem cell self-renewal and differentiation. Cell Death Dis. 4, e537 (2013). - PMC - PubMed
    1. Urao N. & Ushio-Fukai M. Redox regulation of stem/progenitor cells and bone marrow niche. Free Radic. Biol. Med. 54, 26–39 (2013). - PMC - PubMed
    1. Schafer F. Q. & Buettner G. R. Redox environment of the cell as viewed through the redox state of the glutathione disulfide/glutathione couple. Free Radic. Biol. Med. 30, 1191–1212 (2001). - PubMed
    1. Putker M., Vos H. R. & Dansen T. B. Intermolecular disulfide-dependent redox signalling. Biochem. Soc. Trans. 42, 971–978 (2014). - PubMed
    1. Holmström K. M. & Finkel T. Cellular mechanisms and physiological consequences of redox-dependent signalling. Nat. Rev. Mol. Cell. Biol. 15, 411–421 (2014). - PubMed

Publication types

MeSH terms