

Cardiac effects of seasonal ambient particulate matter and ozone co-exposure in rats
- PMID: 25944145
- PMCID: PMC4419498
- DOI: 10.1186/s12989-015-0087-3
Cardiac effects of seasonal ambient particulate matter and ozone co-exposure in rats
Abstract
Background: The potential for seasonal differences in the physicochemical characteristics of ambient particulate matter (PM) to modify interactive effects with gaseous pollutants has not been thoroughly examined. The purpose of this study was to compare cardiac responses in conscious hypertensive rats co-exposed to concentrated ambient particulates (CAPs) and ozone (O3) in Durham, NC during the summer and winter, and to analyze responses based on particle mass and chemistry.
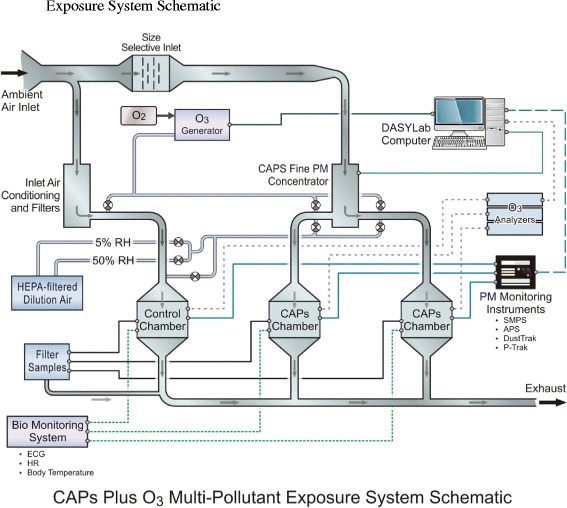
Methods: Rats were exposed once for 4 hrs by whole-body inhalation to fine CAPs alone (target concentration: 150 μg/m3), O3 (0.2 ppm) alone, CAPs plus O3, or filtered air during summer 2011 and winter 2012. Telemetered electrocardiographic (ECG) data from implanted biosensors were analyzed for heart rate (HR), ECG parameters, heart rate variability (HRV), and spontaneous arrhythmia. The sensitivity to triggering of arrhythmia was measured in a separate cohort one day after exposure using intravenously administered aconitine. PM elemental composition and organic and elemental carbon fractions were analyzed by high-resolution inductively coupled plasma-mass spectrometry and thermo-optical pyrolytic vaporization, respectively. Particulate sources were inferred from elemental analysis using a chemical mass balance model.
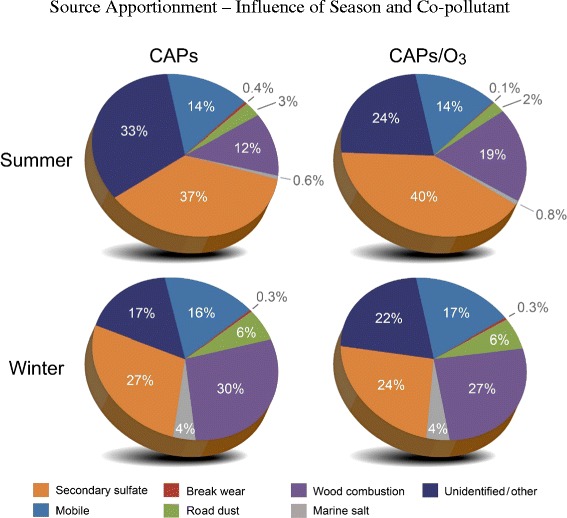
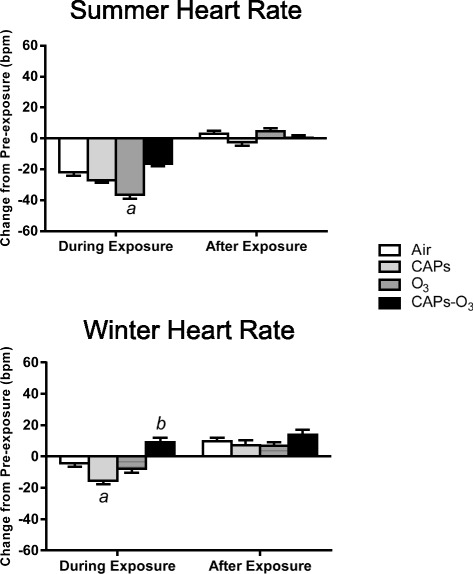
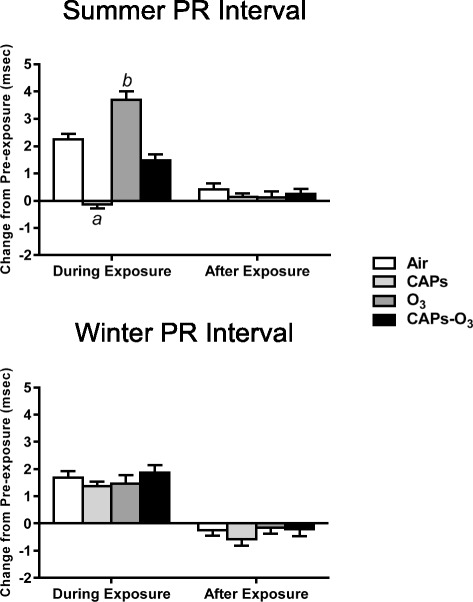
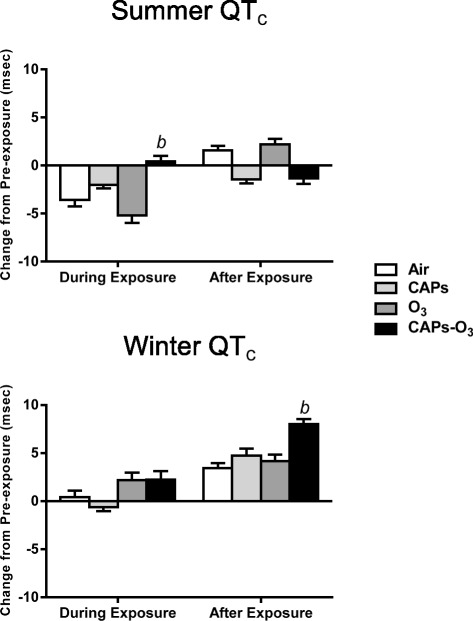
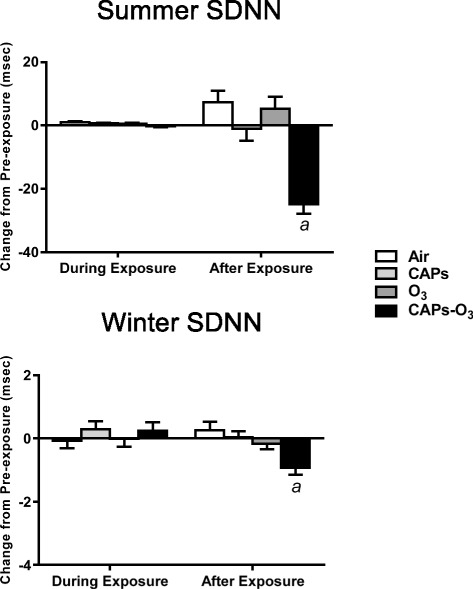
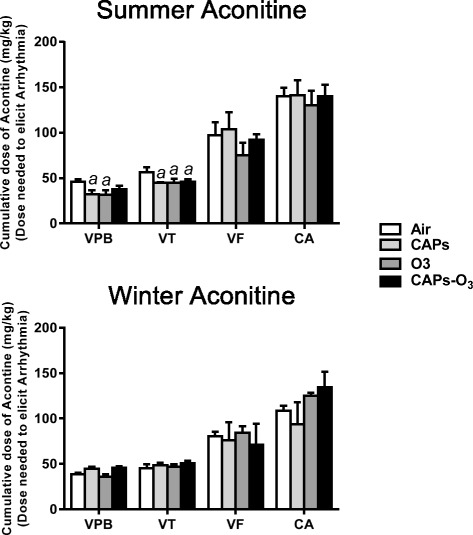
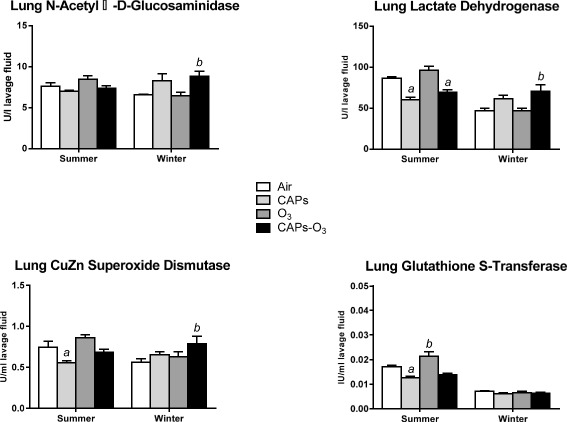
Results: Seasonal differences in CAPs composition were most evident in particle mass concentrations (summer, 171 μg/m3; winter, 85 μg/m3), size (summer, 324 nm; winter, 125 nm), organic:elemental carbon ratios (summer, 16.6; winter, 9.7), and sulfate levels (summer, 49.1 μg/m3; winter, 16.8 μg/m3). Enrichment of metals in winter PM resulted in equivalent summer and winter metal exposure concentrations. Source apportionment analysis showed enrichment for anthropogenic and marine salt sources during winter exposures compared to summer exposures, although only 4% of the total PM mass was attributed to marine salt sources. Single pollutant cardiovascular effects with CAPs and O3 were present during both summer and winter exposures, with evidence for unique effects of co-exposures and associated changes in autonomic tone.
Conclusions: These findings provide evidence for a pronounced effect of season on PM mass, size, composition, and contributing sources, and exposure-induced cardiovascular responses. Although there was inconsistency in biological responses, some cardiovascular responses were evident only in the co-exposure group during both seasons despite variability in PM physicochemical composition. These findings suggest that a single ambient PM metric alone is not sufficient to predict potential for interactive health effects with other air pollutants.
Figures
Similar articles
-
Effects of concentrated ambient particles on normal and hypersecretory airways in rats.Res Rep Health Eff Inst. 2004 Aug;(120):1-68; discussion 69-79. Res Rep Health Eff Inst. 2004. PMID: 15543855
-
Ozone co-exposure modifies cardiac responses to fine and ultrafine ambient particulate matter in mice: concordance of electrocardiogram and mechanical responses.Part Fibre Toxicol. 2014 Oct 16;11:54. doi: 10.1186/s12989-014-0054-4. Part Fibre Toxicol. 2014. PMID: 25318591 Free PMC article.
-
Influence of season and location on pulmonary response to California's San Joaquin Valley airborne particulate matter.J Toxicol Environ Health A. 2012;75(5):253-71. doi: 10.1080/15287394.2012.640102. J Toxicol Environ Health A. 2012. PMID: 22409489
-
Health effects of concentrated ambient air particulate matter (CAPs) and its components.Crit Rev Toxicol. 2009;39(10):865-913. doi: 10.3109/10408440903300080. Crit Rev Toxicol. 2009. PMID: 19863385 Review.
-
The health significance of gas- and particle-phase terpene oxidation products: a review.Environ Int. 2013 Oct;60:145-62. doi: 10.1016/j.envint.2013.08.002. Epub 2013 Sep 13. Environ Int. 2013. PMID: 24036325 Review.
Cited by
-
A single exposure to eucalyptus smoke sensitizes rats to the postprandial cardiovascular effects of a high carbohydrate oral load.Inhal Toxicol. 2020 Jul;32(8):342-353. doi: 10.1080/08958378.2020.1809572. Epub 2020 Aug 24. Inhal Toxicol. 2020. PMID: 32838590 Free PMC article.
-
Impact of Environmental Degradation on Human Health: An Assessment Using Multicriteria Decision Making.Front Public Health. 2022 Jan 20;9:812743. doi: 10.3389/fpubh.2021.812743. eCollection 2021. Front Public Health. 2022. PMID: 35127627 Free PMC article.
-
Effect of short-term exposure to ambient air pollutants on non-accidental mortality in emergency department visits: a time-series study.Front Public Health. 2023 Jun 30;11:1208514. doi: 10.3389/fpubh.2023.1208514. eCollection 2023. Front Public Health. 2023. PMID: 37457252 Free PMC article.
-
TRPA1 mediates the cardiac effects of acrolein through parasympathetic dominance but also sympathetic modulation in mice.Toxicol Appl Pharmacol. 2018 May 15;347:104-114. doi: 10.1016/j.taap.2018.03.027. Epub 2018 Apr 5. Toxicol Appl Pharmacol. 2018. PMID: 29627347 Free PMC article.
-
Ozone Aggravated the Toxicity of Fine Particulate Matter by Impairing Membrane Stability and Facilitating Particle Internalization.Toxics. 2025 May 28;13(6):446. doi: 10.3390/toxics13060446. Toxics. 2025. PMID: 40559919 Free PMC article.
References
MeSH terms
Substances
LinkOut - more resources
Full Text Sources
Other Literature Sources
Medical
Miscellaneous
