. 2015 May 6:6:7073.
doi: 10.1038/ncomms8073.

The low-affinity complex of cytochrome c and its peroxidase

Affiliations

The low-affinity complex of cytochrome c and its peroxidase

Karen Van de Water et al. Nat Commun. .

Abstract

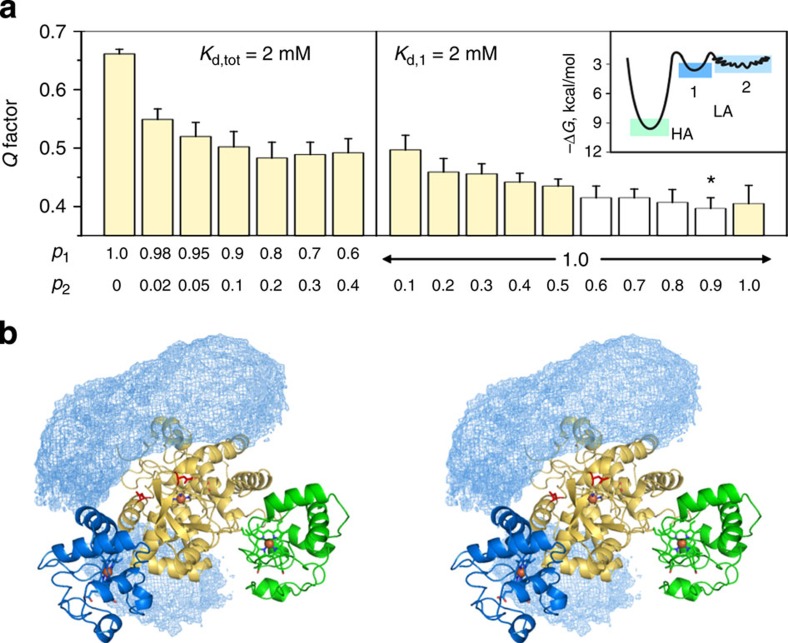
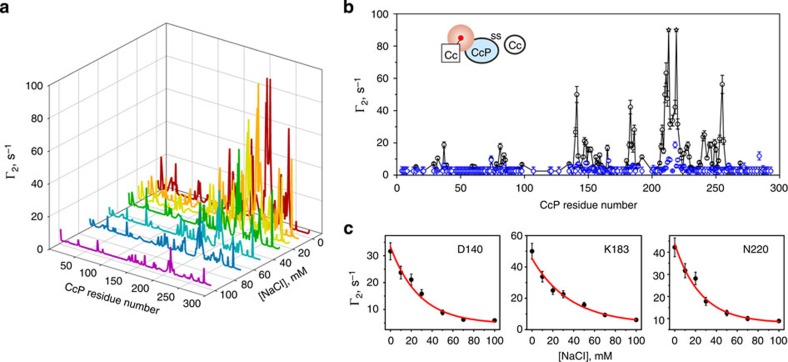
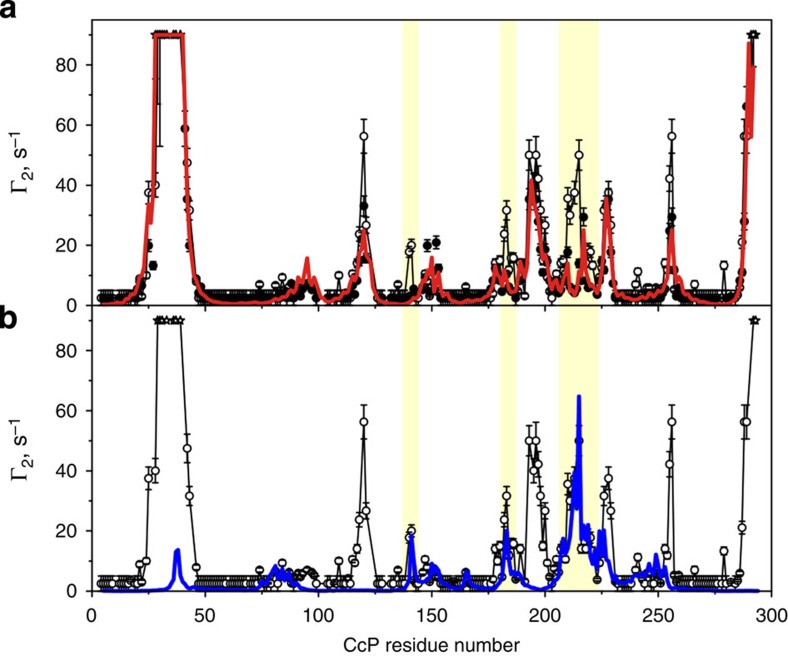
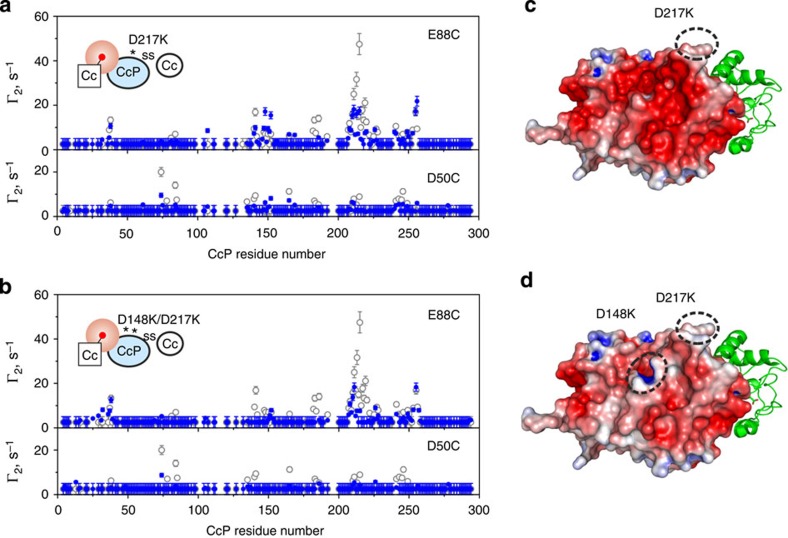
The complex of yeast cytochrome c peroxidase and cytochrome c is a paradigm of the biological electron transfer (ET). Building on seven decades of research, two different models have been proposed to explain its functional redox activity. One postulates that the intermolecular ET occurs only in the dominant, high-affinity protein-protein orientation, while the other posits formation of an additional, low-affinity complex, which is much more active than the dominant one. Unlike the high-affinity interaction-extensively studied by X-ray crystallography and NMR spectroscopy-until now the binding of cytochrome c to the low-affinity site has not been observed directly, but inferred mainly from kinetics experiments. Here we report the structure of this elusive, weak protein complex and show that it consists of a dominant, inactive bound species and an ensemble of minor, ET-competent protein-protein orientations, which summarily account for the experimentally determined value of the ET rate constant.


Figures

Figure 1
Figure 1. Characterization of the [D, 15N] V197C CcP–A81C Cc disulfide CL.
(a) Purification of the CL by cation-exchange chromatography. The solid and dashed lines show the ultraviolet absorbance and the linear salt gradient (from 0 to 1 M NaCl in 20 mM NaPi pH 6.0), respectively, for protein elution from a HiTrap SP FF column (GE Healthcare). Protein fractions analysed by SDS–PAGE are indicated by the arrows. The pooled fractions, containing the pure CL, are highlighted. (b) Non-reducing SDS–PAGE of reference samples (wt proteins) and the SP column fractions labelled in a. (ce) SDS–PAGE with (+) and without (−) the disulfide reducing agent DTT of (c,d) the freshly purified CL and (e) the CL stock used for NMR experiments and stored for 1 month at 4 °C. Incubated for 15 min at room temperature, the ‘+' sample in (c) contained 10 mM DTT, while those in (d,e) contained 125 mM DTT and were incubated for 15 min at 99 °C before analysis. For reference, the wt protein samples are included in d. In be, ‘M' denotes the molecular weight marker, with the values indicated on the left. (f) Analysis of the purified CL by analytical size-exclusion chromatography (SEC). Black and red lines show elution of the SEC protein standard (Bio-Rad) and the CL sample, respectively, from ENrich SEC 70 column (Bio-Rad) equilibrated in 20 mM NaPi 0.1 M NaCl pH 6.0. The molecular weights (in kDa) of the reference proteins are indicated in the chromatogram. The expected molecular weight of the CL is 46 kDa.
Figure 2
Figure 2. Binding analysis of the low-affinity Cc–CcP complex.
The CcP-observed Cc binding to the V197C CcP–A81C Cc CL and the Cc-observed binding of the CL in 20 mM NaPi pH 6.0 at 25 °C. (a,b) Selected regions of the overlaid [1H, 15N] heteronuclear single-quantum correlation spectra of the free proteins (blue) and in the presence of 5 equivalents of the corresponding binding partner (brown), showing typical chemical shift perturbations upon complex formation. The insets schematically depict the experimental set-up, with the NMR-active proteins coloured light blue. The symbol ‘s' identifies a sidechain amide resonance. (c,d) NMR chemical shift titrations of (c) CL CcP nuclei A147 HN (open circles), D148 HN (filled circles), E214 HN (open squares) and L213 N (filled squares) and (d) Cc HN atoms of K86 (filled circles) and K5 (open circles). The curves in each plot were fitted simultaneously to a binding model with the shared Kd. The solid lines show the best fits with the Kd values of 1.74±0.25 mM (CL-observed) and 2.30±0.66 mM (Cc-observed). (e,f) Binding-induced, combined chemical shift perturbations (Δδ) of the backbone amides of (e) CL CcP and (f) Cc. The horizontal lines indicate the average Δδ and the average plus one standard deviation. Several clusters of residues most affected by the binding are indicated by the labels, with the Δδ coloured orange. (g) The Δδ heat maps (coloured from 0.001 p.p.m. in blue to 0.02 p.p.m. in red; prolines and the residues with unassigned or unobserved backbone amide resonances are in grey) for the CL CcP and Cc. The labels indicate several residues affected by the binding. (h) Electrostatic properties of Cc and CcP, with molecular surfaces coloured by the electrostatic potential (from −5 kBT in red to +5 kBT in blue) calculated with APBS. The molecular views in g,h show X-ray structure of the Cc–CcP CL (PDB 1S6V) with Cc as the green ribbon and CcP as the molecular surface and the Cc interface, with the haem group (g) coloured magenta or (h) shown in sticks.
Figure 3
Figure 3. Structure of the low-affinity Cc–CcP complex.
(a) Intermolecular, CcP-observed PREs for the CL in the complex with Cc paramagnetically labelled at E88C, D50C, and E66C. The plots show measured PREs (open symbols), Γ2 values back-calculated from the single, lowest-energy CL–Cc structure (blue line) and the PREs calculated for the combination of the dominant binding geometry and multiple protein–protein orientations obtained in a typical ensemble refinement run (red line). The errors are s.d. The inset schematically depicts the experimental set-up, with the NMR-active protein coloured light blue and the attached paramagnetic label indicated by the red sphere. (b) The structure of the dominant form of the CL–Cc complex. Cc bound to the low-affinity CcP site is shown as blue cartoon, while the CL CcP and Cc are represented as the yellow molecular surface and the green cartoon, respectively. The CL orientation is the same as in Fig. 2g. CcP residues D148 and D217 are coloured red. Haem groups are shown as sticks, with iron atoms as spheres. (c) The intermolecular interface of the dominant low-affinity binding orientation. The proteins are coloured as in b. CcP residues D148 and D217 and Cc residues K5, T12 and K86 spacefilled and shown in blue and orange, respectively.
Figure 4
Figure 4. PRE control experiments.
Intermolecular PREs for the backbone amide resonances of (ac) 15N Cc caused by (a) CcP E221C-EDTA(Mn2+), (b) Ub D32C-EDTA(Mn2+) and (c) free paramagnetic label; and (df) [D, 15N] wt CcP caused by (d) Cc E88C-EDTA(Mn2+), (e) Ub D32C-EDTA(Mn2+) and (f) free paramagnetic label. Stars indicate the residues whose resonances disappear in the paramagnetic spectrum. The errors are s.d. The insets schematically depict the experimental set-up, with the NMR-active protein coloured light blue and the paramagnetic label indicated by the red sphere. The Cc regions that experience strong PREs are highlighted. The NMR samples contained (a) 0.3 mM of CcP E221C-EDTA(Mn2+) and 3 equivalents of 15N Cc; (b) 0.3 mM 15N Cc and 3 equivalents of Ub D32C-EDTA(Mn2+); (c) 0.3 mM wt CcP, 0.45 mM each of 15N-labelled and natural-abundance Cc, and 0.45 mM of the free paramagnetic label; (d) 0.4 mM [D, 15N] wt CcP and 3 equivalents of Cc E88C-EDTA(Mn2+); (e) 0.4 mM [D, 15N] wt CcP and 3 equivalents of Ub D32C-EDTA(Mn2+). The sample in f was generated from that in d by addition of twofold molar excess (relative to Cc) of DTT, which breaks the disulfide bond between Cc and the EDTA(Mn2+) moiety, releasing the latter into the solution. All experiments were conducted in 20 mM NaPi pH 6.0 at 25 °C.
Figure 5
Figure 5. Ensemble refinement of the lowly populated CL–Cc forms.
(a) Q factors for ensemble refinement of CL–Cc complexes at varying relative populations of the two bound species, p1 and p2, and two binding scenarios (see text). White bars indicate the smallest Q values. An asterisk identifies the data set presented in b. The inset shows a schematic energy diagram for the native, non-covalent Cc–CcP complex, where ‘HA' and ‘LA' refer to the high- and low-affinity domains, respectively, and ‘1' and ‘2' indicate the two binding sites of the latter (see text for details). (b) Stereo image showing Cc molecules in the dominant binding geometry (blue cartoon) and multiple minor forms of the low-affinity Cc–CcP complex, displayed as a reweighted atomic probability density map for the overall distribution of the Cc heavy atoms plotted at a threshold of 40% maximum. The CL CcP and Cc are coloured yellow and green, respectively.
Figure 6
Figure 6. Effect of the ionic strength on the intermolecular PREs in the CL–Cc system.
(a) CcP-observed Γ2 PREs for the CL in the presence of 3 equivalents of Cc E88C-EDTA(Mn2+) in 20 mM NaPi pH 6.0 at varying concentrations of NaCl. (b) Comparison of the PRE profiles obtained at 0 mM (black) and 100 mM (blue) NaCl. Stars indicate the residues whose resonances disappear in the paramagnetic spectrum. The errors are s.d. The inset schematically depicts the experimental set-up, with the NMR-active protein coloured light blue, and the attached paramagnetic label indicated by the red sphere. (c) Ionic strength dependence of Γ2 for several CL CcP residues. The errors are s.d. The red lines show the best fits to an exponential decay function with the decay rates of 28±4 (D140, r2=0.97), 36±6 (K183, r2=0.98) and 25±4 (N220, r2=0.98).
Figure 7
Figure 7. PREs for the native non-covalent Cc–CcP complexes at low and high ionic strengths.
(a,b) Intermolecular PREs for the backbone amide resonances of [D, 15N] wt CcP interacting with Cc E88C-EDTA(Mn2+) in 20 mM NaPi pH 6.0 and [NaCl]=0 mM (open symbols) or [NaCl]=100 mM (filled symbols). The high and low-salt samples contained 0.4 mM CcP and 1 or 3 equivalents of Cc, respectively. The high-salt data were taken from our previous work. The red line in a shows the Γ2 values calculated for the combination of the high-affinity binding orientation and the encounter complex at [NaCl]=100 mM. The blue line in (b) represents the PREs calculated for the combination of the dominant binding geometry and multiple, lowly populated protein–protein orientations constituting the low-affinity Cc–CcP complex (studied in this work) and corresponds to the red trace in Fig. 3a. Several regions exhibiting differences between the high- and low-salt PRE profiles are highlighted.
Figure 8
Figure 8. PRE NMR analysis of the Cc interaction with the charge-reversal CcP–Cc CLs.
(a,b) Intermolecular, CcP-observed PREs caused by the binding of the paramagnetically labelled E88C and D50C Cc to (a) D217K/V197C and (b) D148K/D217K/V197C [D, 13C, 15N] CcP–A81C Cc CLs. The measured PREs (blue symbols) are compared with those of the original, ‘wt' CL (open symbols; also shown in Fig. 3a). The errors are s.d. The insets schematically depict the experimental set-up, with the NMR-active protein coloured light blue, the attached paramagnetic label indicated by the red sphere and point mutations represented by asterisks. (c,d) The charge-reversal CLs with the molecular surface of CcP coloured by the electrostatic potential (from −5 kBT in red to +5 kBT in blue, calculated with APBS). The protein orientations are the same as in Fig. 2h. The introduced mutations are indicated by dashed circles. All NMR samples contained 0.5 mM CL and 1 equivalents of Cc in 20 mM NaPi pH 6.0.
Figure 9
Figure 9. ET properties of the low-affinity Cc–CcP complex.
(a,b) Distributions of the edge-to-edge (a) haem–haem and (b) Cc haem–CcP W191 distances in the low-affinity complex. The values are averaged over the data sets highlighted in Fig. 5a; the errors are s.d. The solid and dashed lines indicate the corresponding distances in the crystallographic orientation and the dominant low-affinity binding form, respectively. (c) Shortest edge-to-edge separations (in Å) among the redox centres in the high-affinity (thick lines) and low-affinity (thin lines and solid cylinders) complexes. Surface outlines of CcP and Cc in the crystallographic orientation are coloured yellow and green, while those of the dominant form and a representative ET active geometry of the low-affinity complex are in blue (bottom left) and cyan (top left), respectively. In the latter, the solid cylinders indicate the intermolecular ET pathway mediated by the covalent bonds (red) of the haem groups and the intervening CcP residue D146 and two through-space jumps (yellow).

Similar articles

Cited by

References

    1. Erman J. E. & Vitello L. B. Yeast cytochrome c peroxidase: mechanistic studies via protein engineering. Biochim. Biophys. Acta 1597, 193–220 (2002). - PubMed
    1. Volkov A. N., Nicholls P. & Worrall J. A. R. The complex of cytochrome c and cytochrome c peroxidase: the end of the road? Biochim. Biophys. Acta 1807, 1482–1503 (2011). - PubMed
    1. Miller M.A. et al. Identifying the physiological electron transfer site of cytochrome c peroxidase by structure-based engineering. Biochemistry 35, 667–673 (1996). - PubMed
    1. Wang K. et al. Design of a ruthenium-cytochrome c derivative to measure electron transfer to the radical cation and oxyferryl heme in cytochrome c peroxidase. Biochemistry 35, 15107–15119 (1996). - PubMed
    1. Miller M. A. A complete mechanism for steady-state oxidation of yeast cytochrome c by yeast cytochrome c peroxidase. Biochemistry 35, 15791–15799 (1996). - PubMed

Publication types

LinkOut - more resources